Transcript
Hello, and welcome to this introduction of ApexSQL Manage. ApexSQL Manage is a powerful and intuitive tool used for managing SQL Server instances. Its wide range of features allows users to discover SQL Server instances and SSRS, SSAS, SSIS services across the network, perform high-level analysis on discovered instances, compare SQL Server instances, snapshots and document them in various file formats. It’s worth noting that all core features of the tool can be easily automated, making the interaction with the tool as easy as possible.
In this video, we’ll demonstrate some of its features and capabilities.
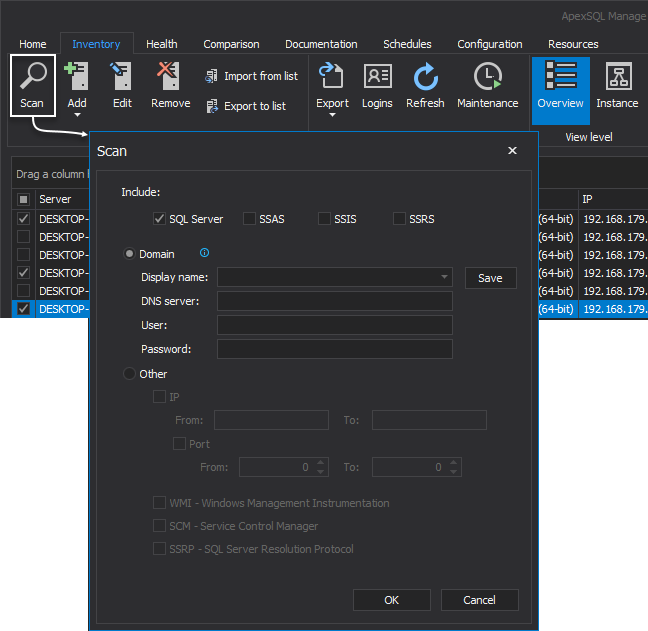
To perform a scan process in the search for SQL Server instances and its services across the network, head over to the Inventory tab and click the Scan button. This will initialize the Scan window with the following search settings to be configured:
- Scan target – search for SQL Server instances with the option to include its services
- Search by domain on a remote machine or
- Search by IP address range
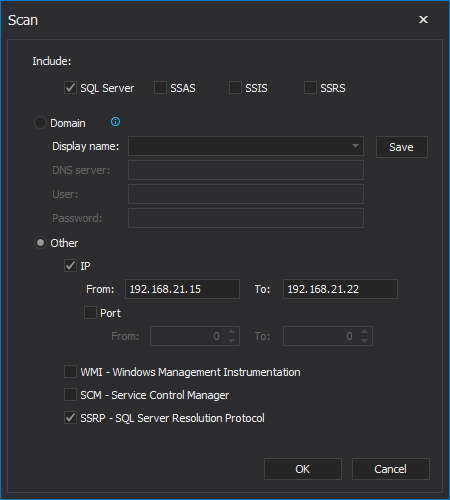
To search SQL Server instances by the latter, select the Other radio button, check the IP checkbox, and insert the address range. Additionally, choose one of the scanning methods and click OK to initiate the search process:
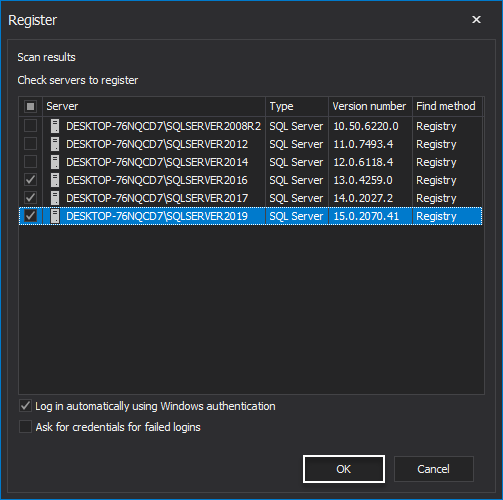
After the scan is complete, the results are shown in the Register window. Choose instances to make a connection with and click the OK button:
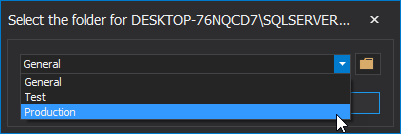
This action will summon an additional window with a list of separate folders for the chosen SQL Server instances to be grouped by:
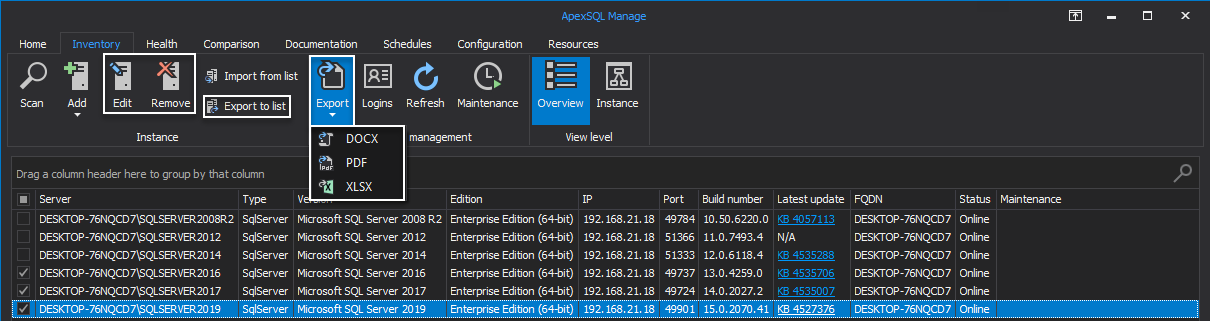
Once the connection is established between the application and chosen instances, the main grid of the Inventory tab is populated with all its details spread across the specific grid columns. The connection can be later edited for listed SQL Server instances; they can be easily removed from the grid, exported to a list for later use, or exported to DOCX, PDF, and XLSX file formats:
To perform health check analysis for a desired instance, shift to the Health tab and click the Run button to initialize the Run health check window:
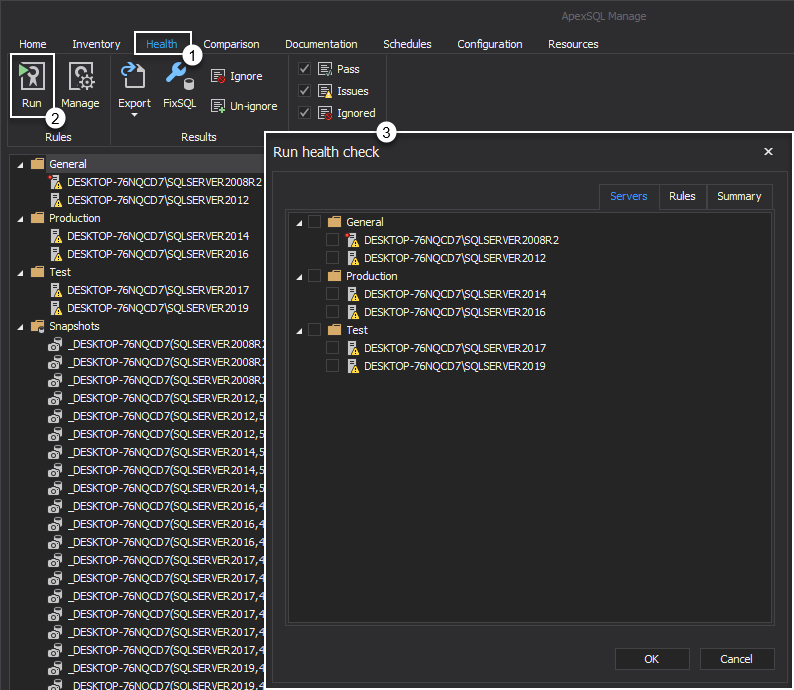
In the Servers tab, choose one or more SQL Server instances to run high-level analysis against and proceed to the Rules tab:
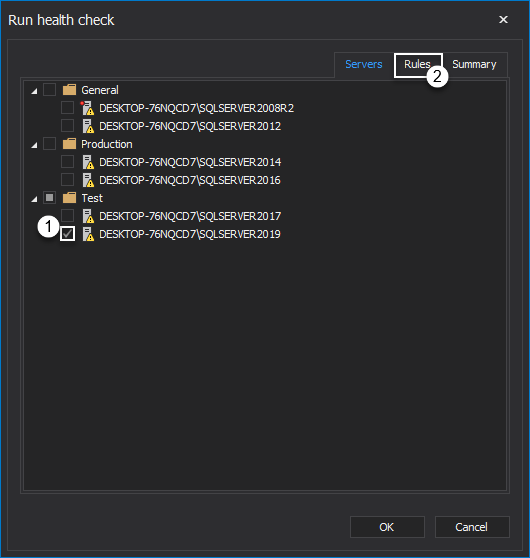
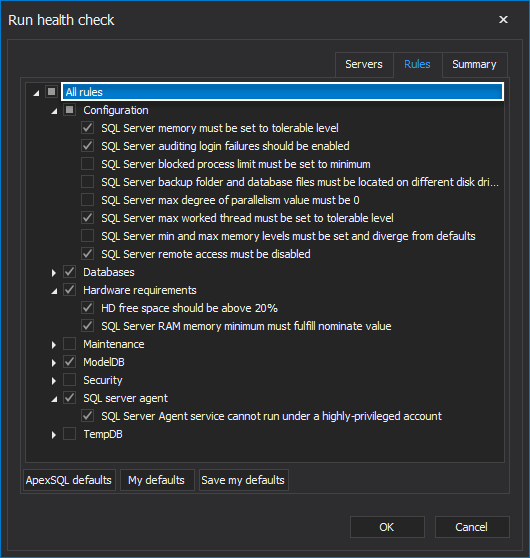
Here, choose the desired set of rules that are grouped into categories to be executed:
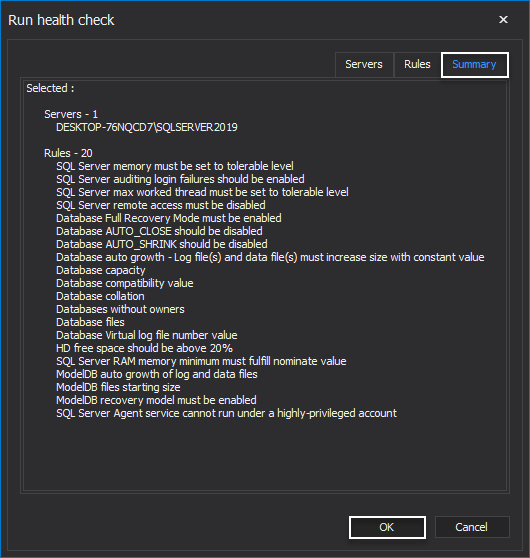
In the Summary tab, all chosen parameters are displayed. Click OK to run the health check analysis:
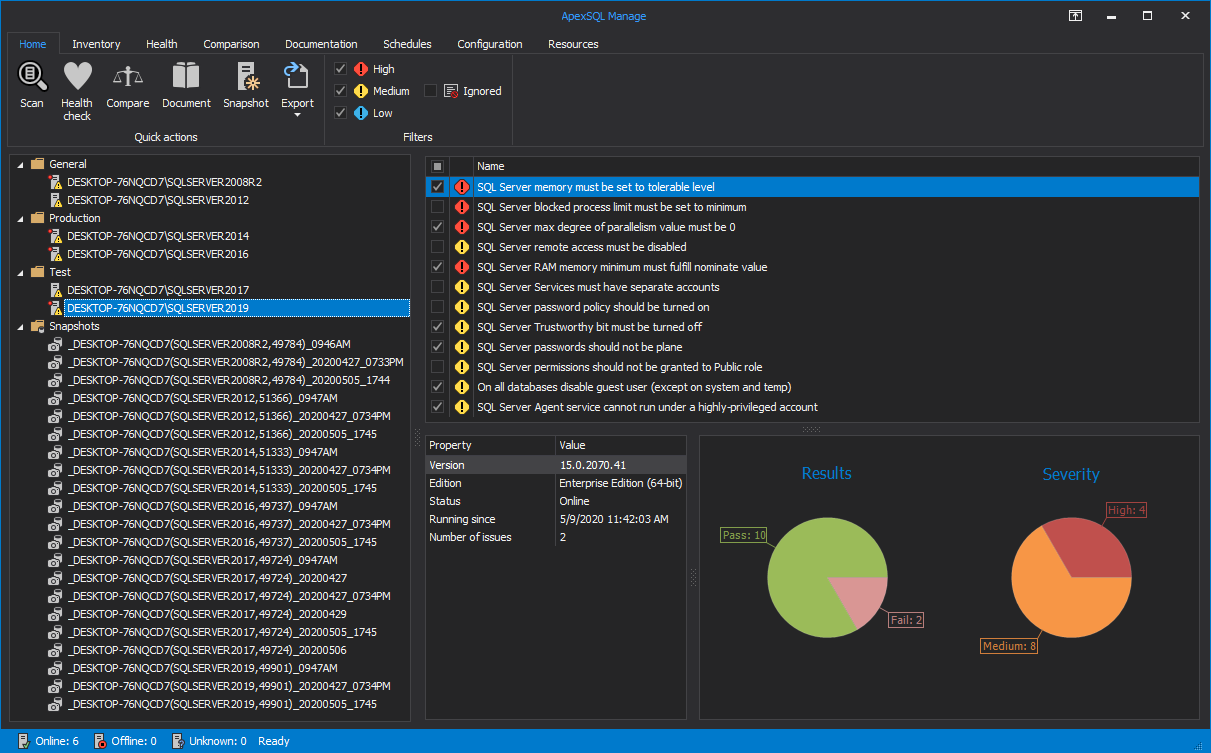
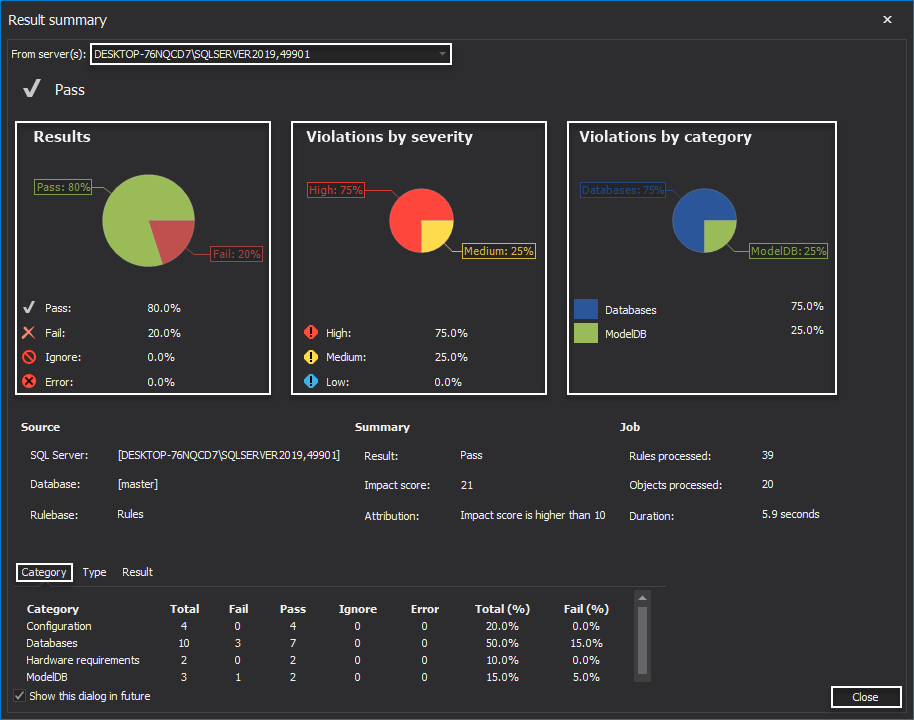
The results of the analysis are displayed in the Result summary dialog in the form of statistics for the chosen SQL Server instance. Passed and failed rules, violations by severity, and category are all shown in the form of a pie graphic percentages. More detailed statistics of executed rules sorted by its categories can be found in the Source section under the Category tab. To exit the summary, click the Close button:
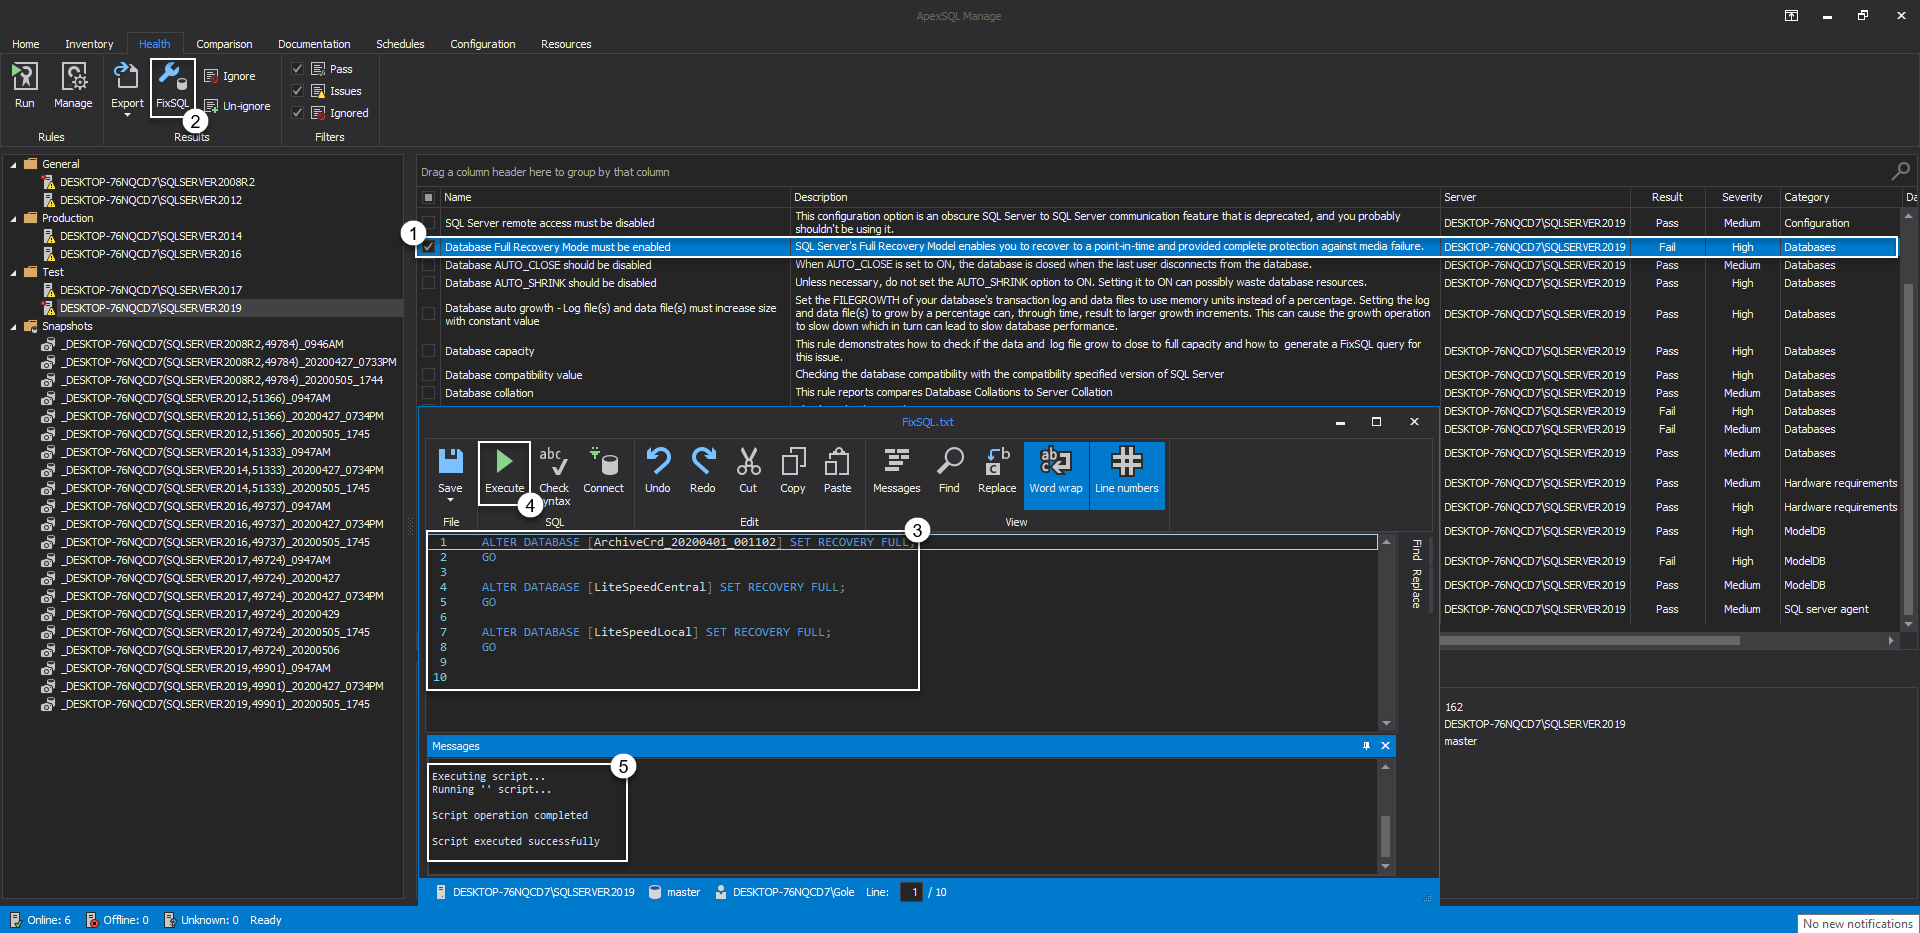
All executed rules are now listed in the main grid of the Inventory tab, with all its details spread across the specific columns. In the Result grid column, check rule with the Fail outcome and click the FixSQL button. This will open the FixSQL text editor with pre-defined code to remedy and fix the failed outcome of the checked rule. Click the Execute button to run the script:
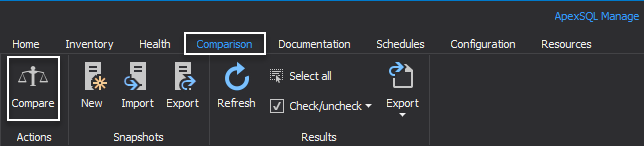
To compare SQL server instances with each other or with previously taken snapshots, head over to the Comparison tab and click the Compare button:
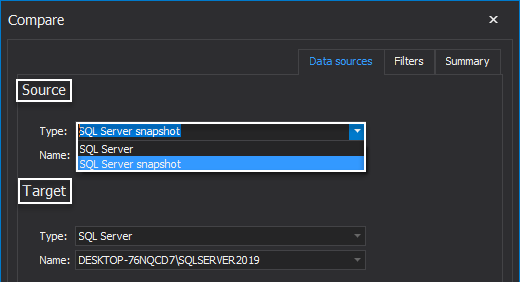
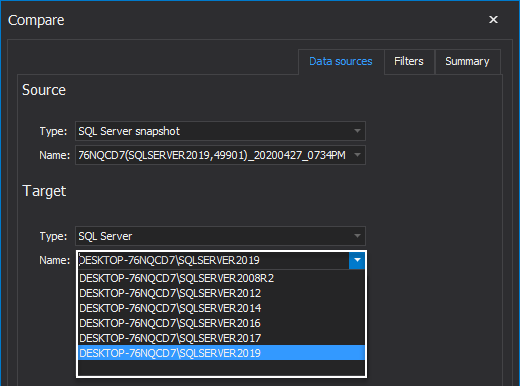
In the Data sources of the Compare window, choose Source and Target of comparison between SQL Server and SQL Server snapshot types and from the Name drop-down list make the desired selection:
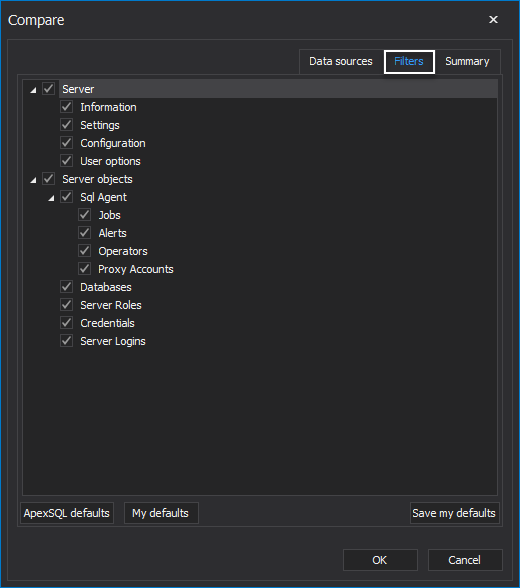
In the Filters tab, choose specific filters to include in the comparison:
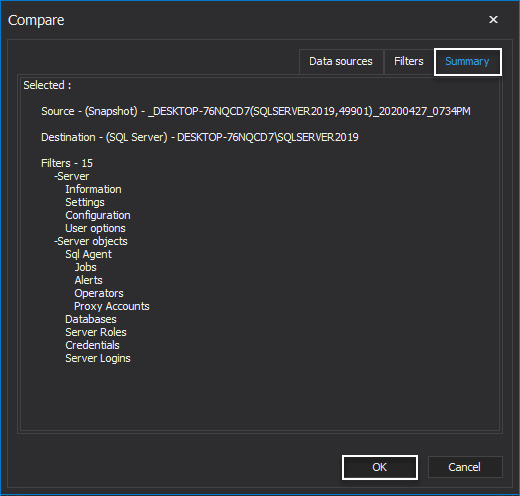
The Summary tab gathers all the previously chosen parameters in one place. Click OK to run the comparison:
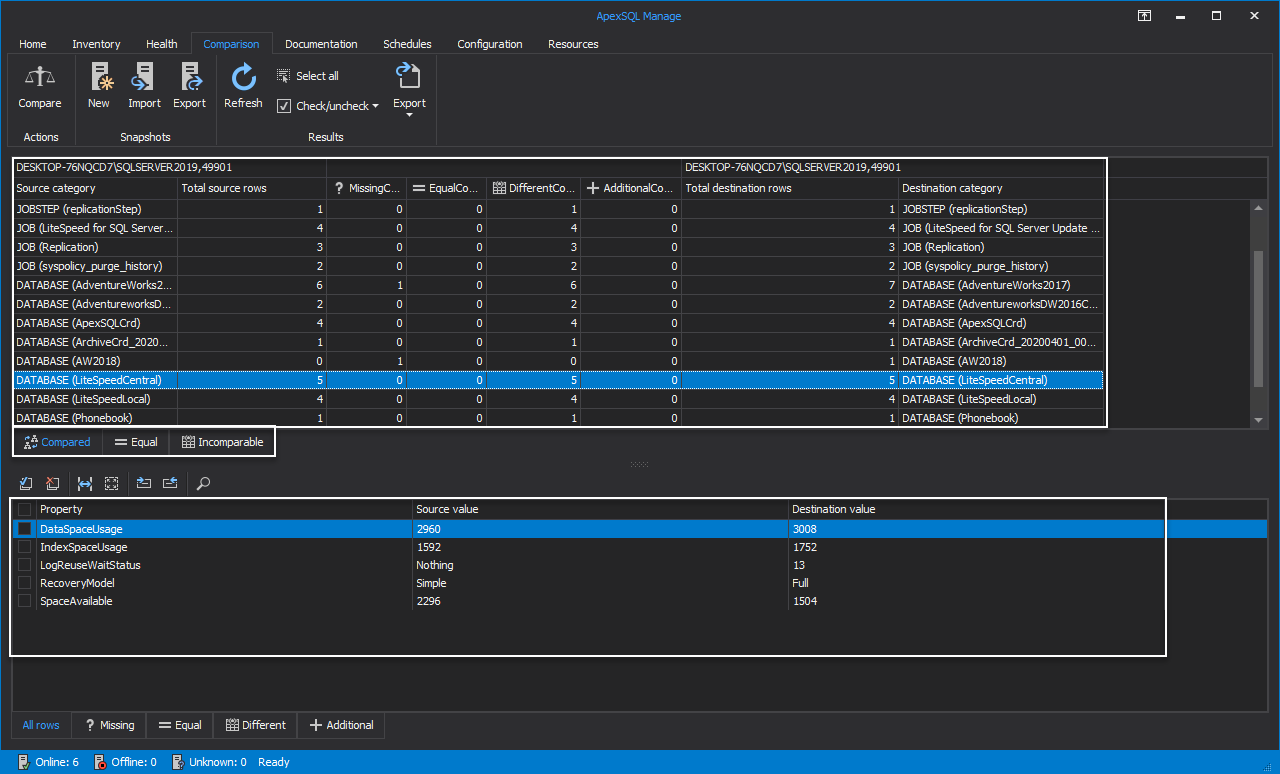
The results are shown in the form of a table with columns and rows showing equalities and differences between the source and the target of previously executed comparison. Click any of the server objects to see its properties with previous and current values:
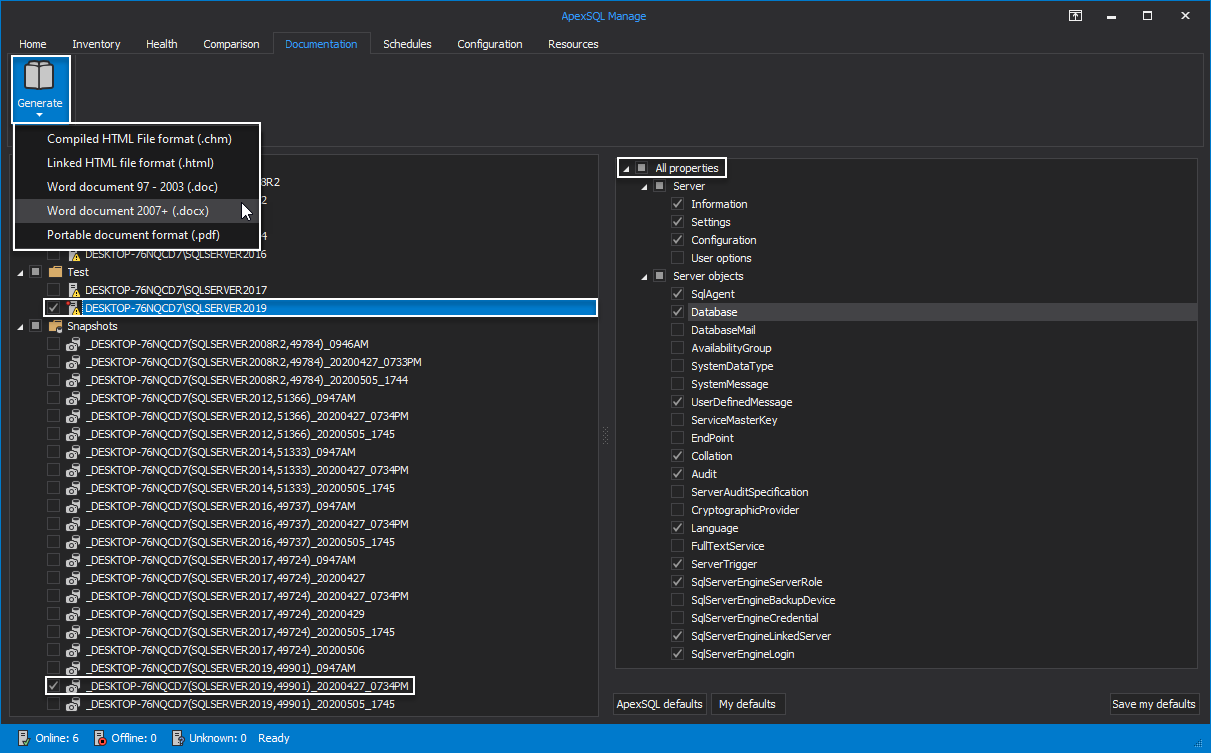
Under the Documentation tab, create detailed documentation for SQL Server instances and its snapshots by checking them from the Server panel list, choosing properties grouped into Server and Server objects categories from the All properties area, and selecting the preferred file format from the Generate drop-down menu:
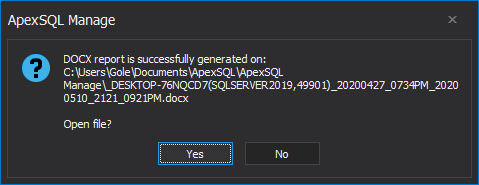
Immediately upon generating the document, you will be asked to open it:
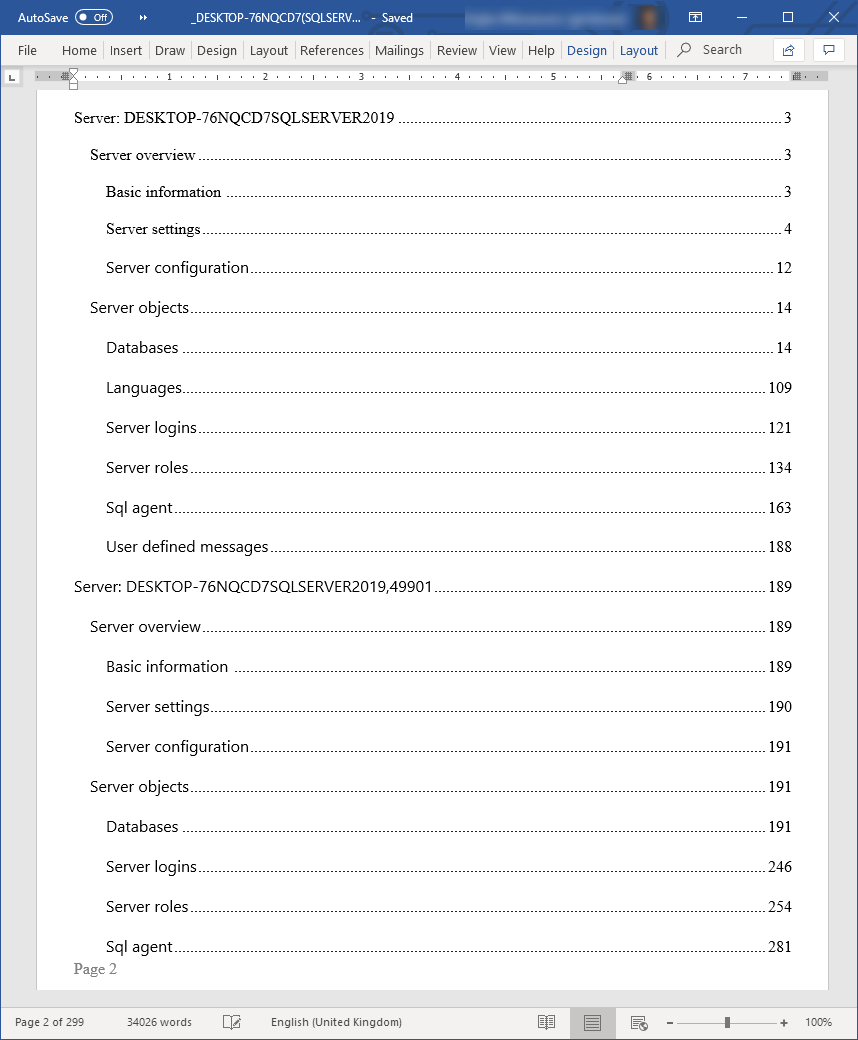
The result will look like this:
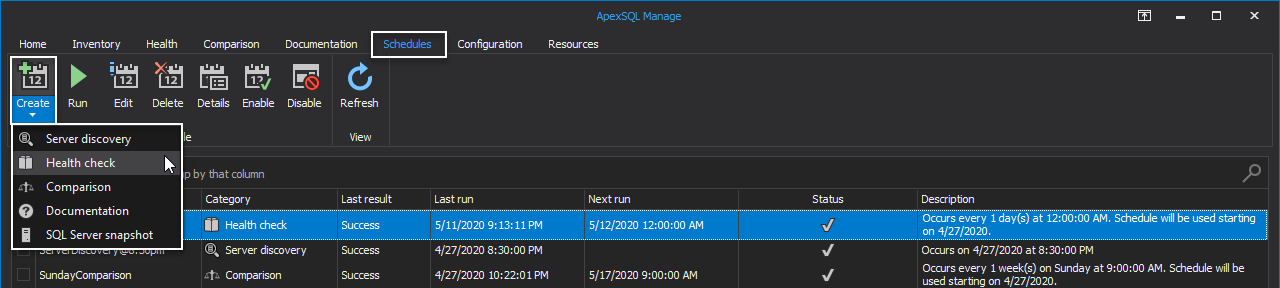
In the Schedules tab, create schedules for all core features of the tool in a few simple steps. Let’s, for instance, assume there is a need to perform a weekly health check analysis for a specific SQL Server instance. To do so, click the Create drop-down menu and choose Health check:
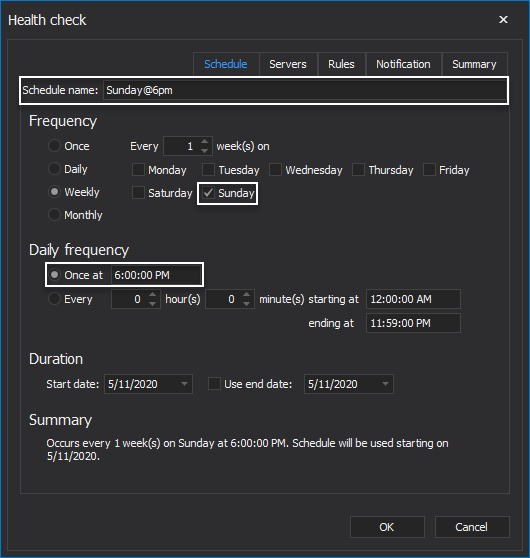
In the Schedules tab of the Health check window insert schedule name and select the day and time of task execution:
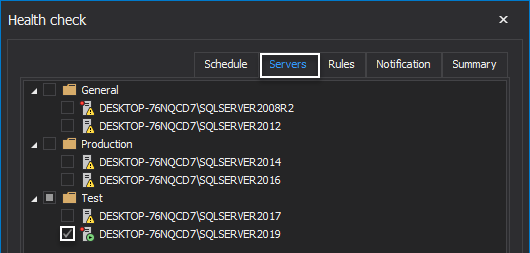
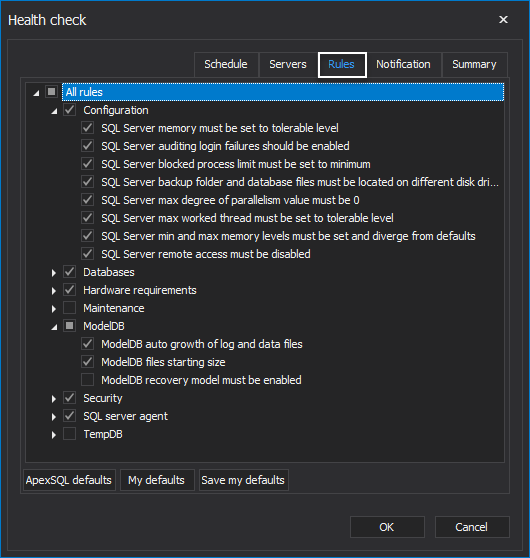
In the Servers tab select a SQL Server to run high-level analysis against and in the Rules tab, choose what rules to include:
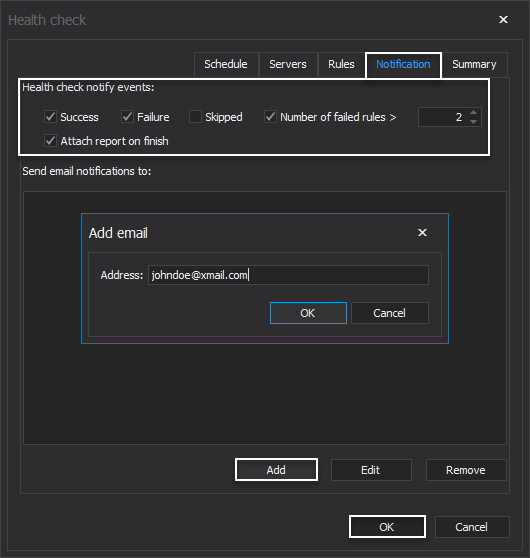
Under the Notification tab, check the desired notify events and add email. Click OK to create the schedule:
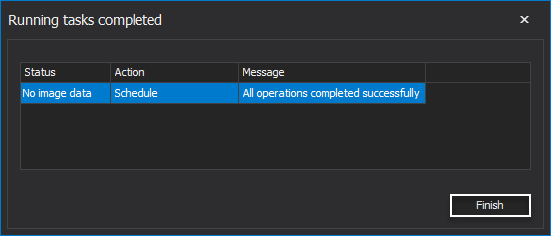
Running tasks completed dialogue will pop-up with the schedule creation outcome. Click Finish to exit:
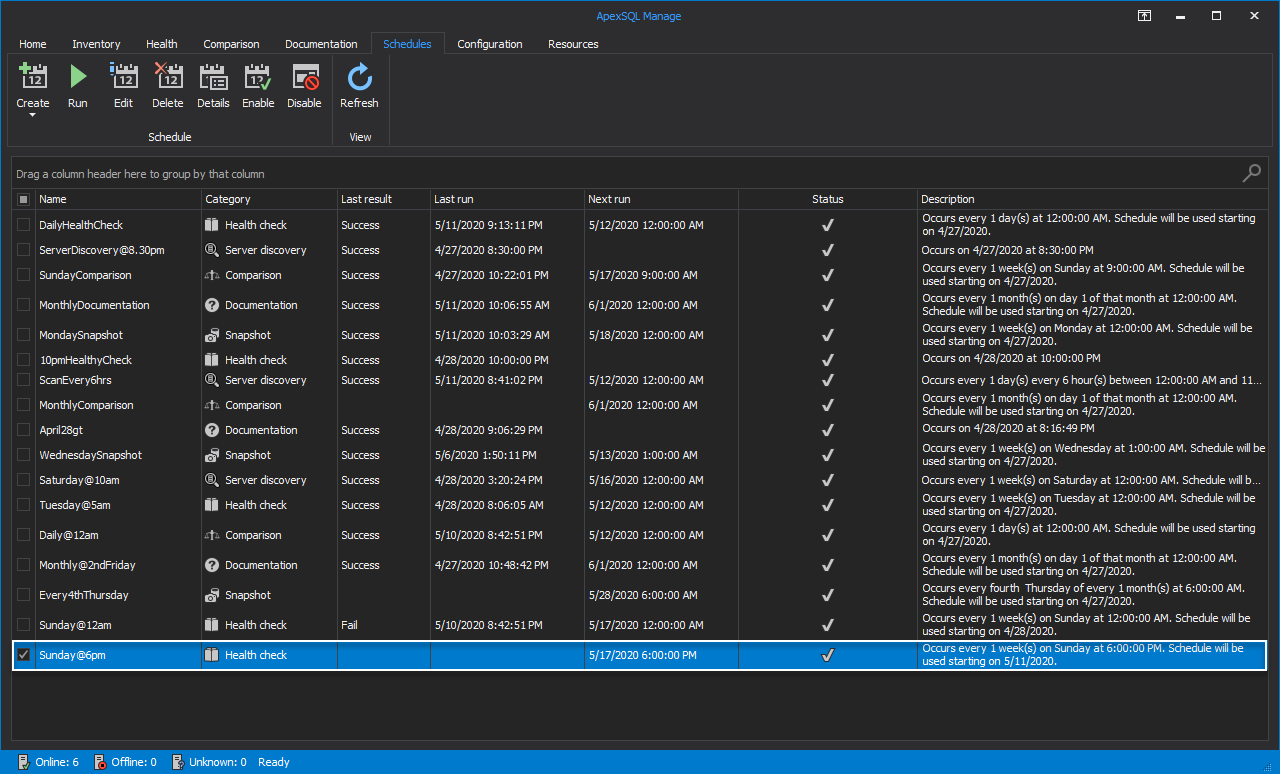
The created schedule is listed in the main grid of the Schedules tab and awaits its execution time:
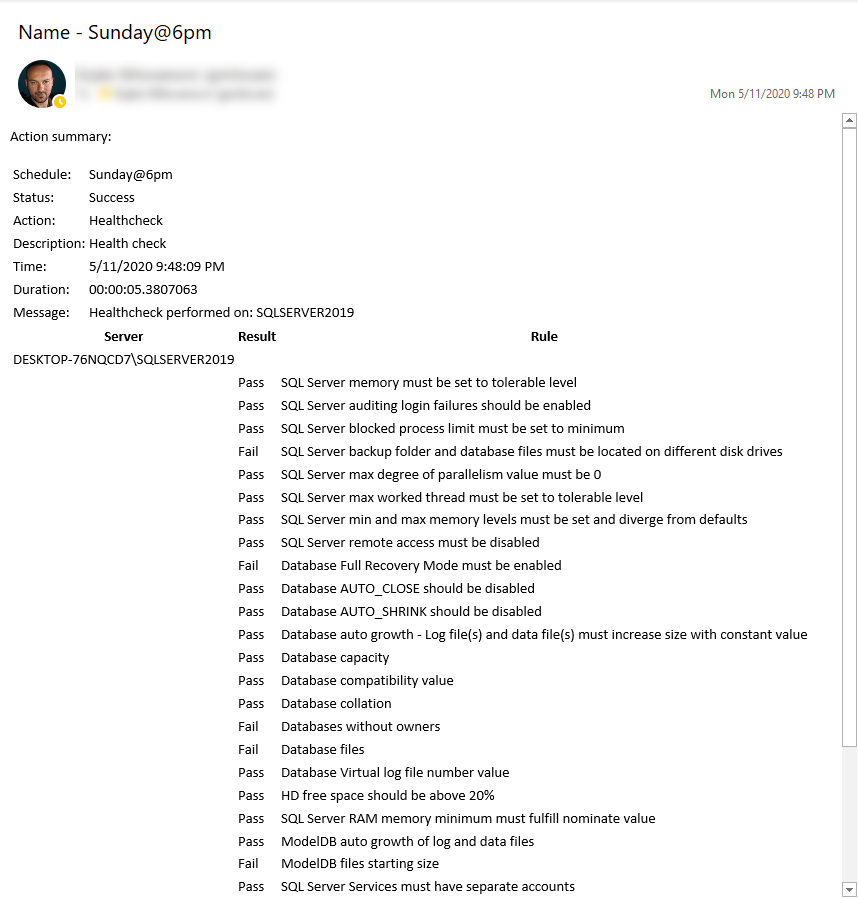
Once it’s executed, the user will get the notification via the provided email account:
Thanks for watching! For more information, please visit apexsql.com