This video shows how to use main sections of the ApexSQL DevOps toolkit Web dashboard, a customizable build agent with Web based user interface used for creating and executing continuous integration and delivery pipelines in SQL Server.
There are five main sections of the ApexSQL DevOps toolkit Web dashboard and they include Pipelines, Activity, Data sources, Options and Resources.
Transcript
Hello, and welcome to this ApexSQL DevOps toolkit Web Dashboard DEMO introduction. The ApexSQL DevOps toolkit Web Dashboard is a customizable build agent with Web based user interface used for creating and executing continuous integration and delivery pipelines in SQL Server.
The ApexSQL DevOps toolkit Web Dashboard enables users to create flexible CI and CD pipelines with highly customizable pipeline steps. The Dashboard utilizes the ApexSQL DevOps toolkit PowerShell code, which resides under-the-hood, via a Web based user interface and provides an easy method for database developers to build, review, document and deploy changes for SQL Server projects with full customization.
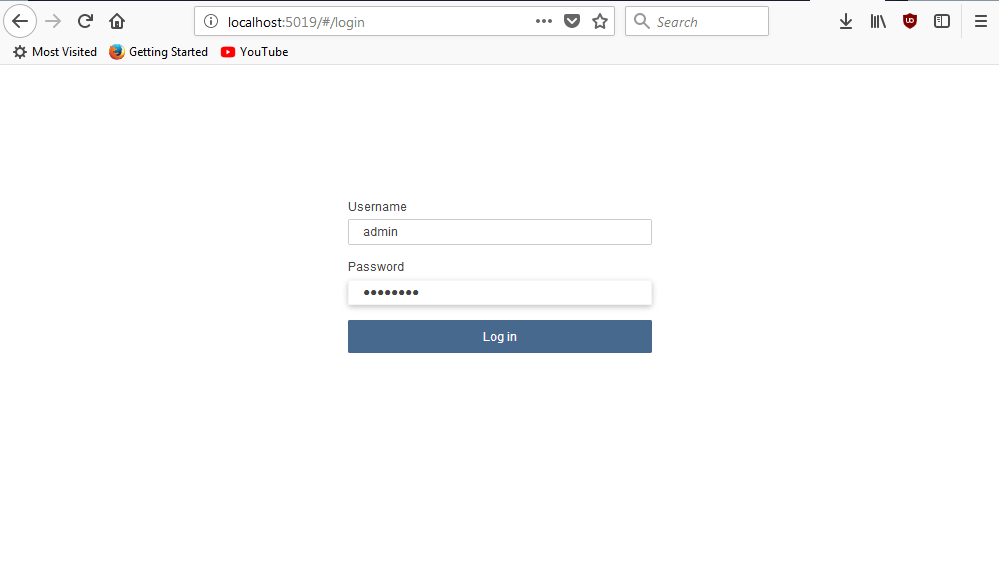
Accessing the Web Dashboard can be done with any web browser by invoking the URL and the designated port of the host where Web Dashboard is installed. After the initial login screen which displays prompts for credentials, the Dashboard will be displayed.
There are five main sections of the ApexSQL DevOps toolkit Web dashboard. They include:
- Pipelines
- Activity
- Data sources
- Options
- Resources
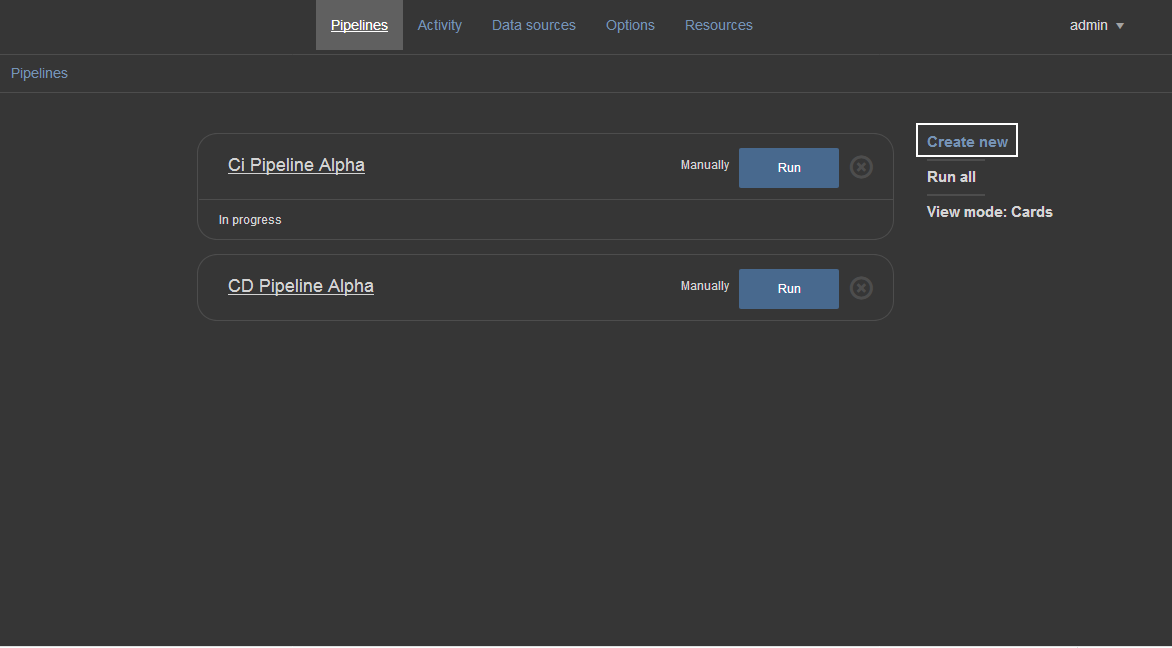
The first section is the Pipeline view. This view contains the list of existing CI/CD pipelines, for the current user, with their most recent execution status. From here, pipelines can be created, removed or executed. Also, existing pipeline configurations can be accessed for editing.
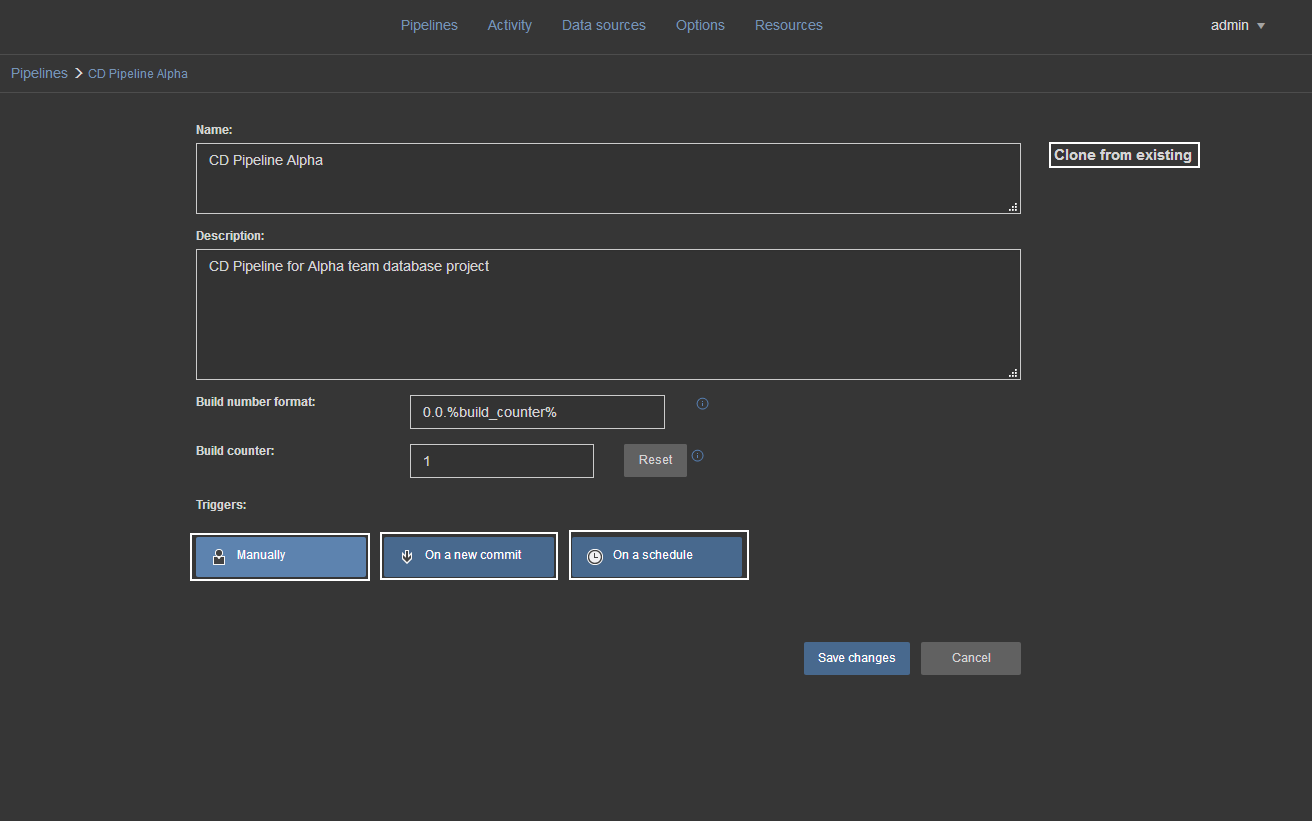
To create a new pipeline use the Create new option and the view for defining basic pipeline parameters like name, description and trigger method will be shown.
There are three methods available to trigger a pipeline’s execution, Manually, On a new commit to the source control repository and On a schedule, with various types of scheduling settings. It is also possible to use the Clone from existing option to use the configuration of a previously created pipeline.
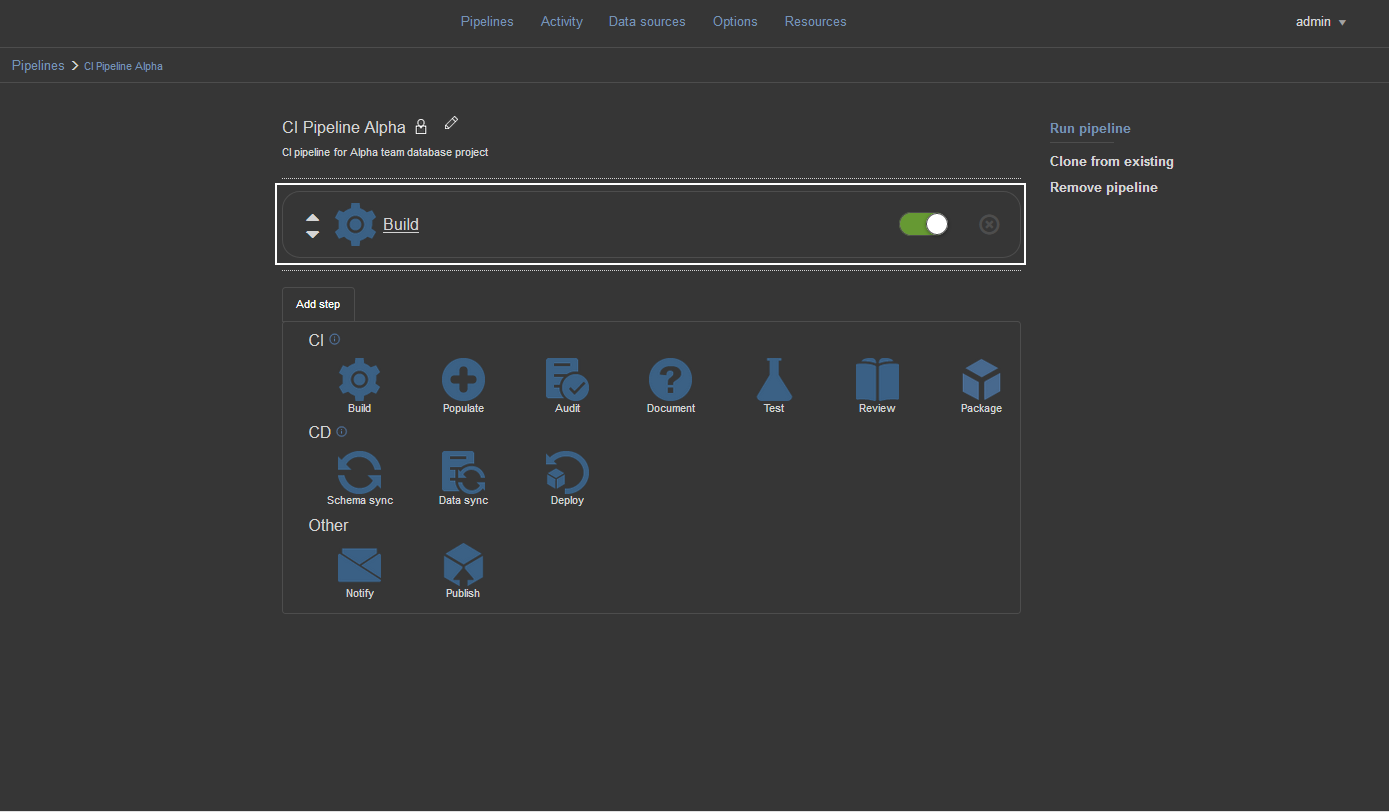
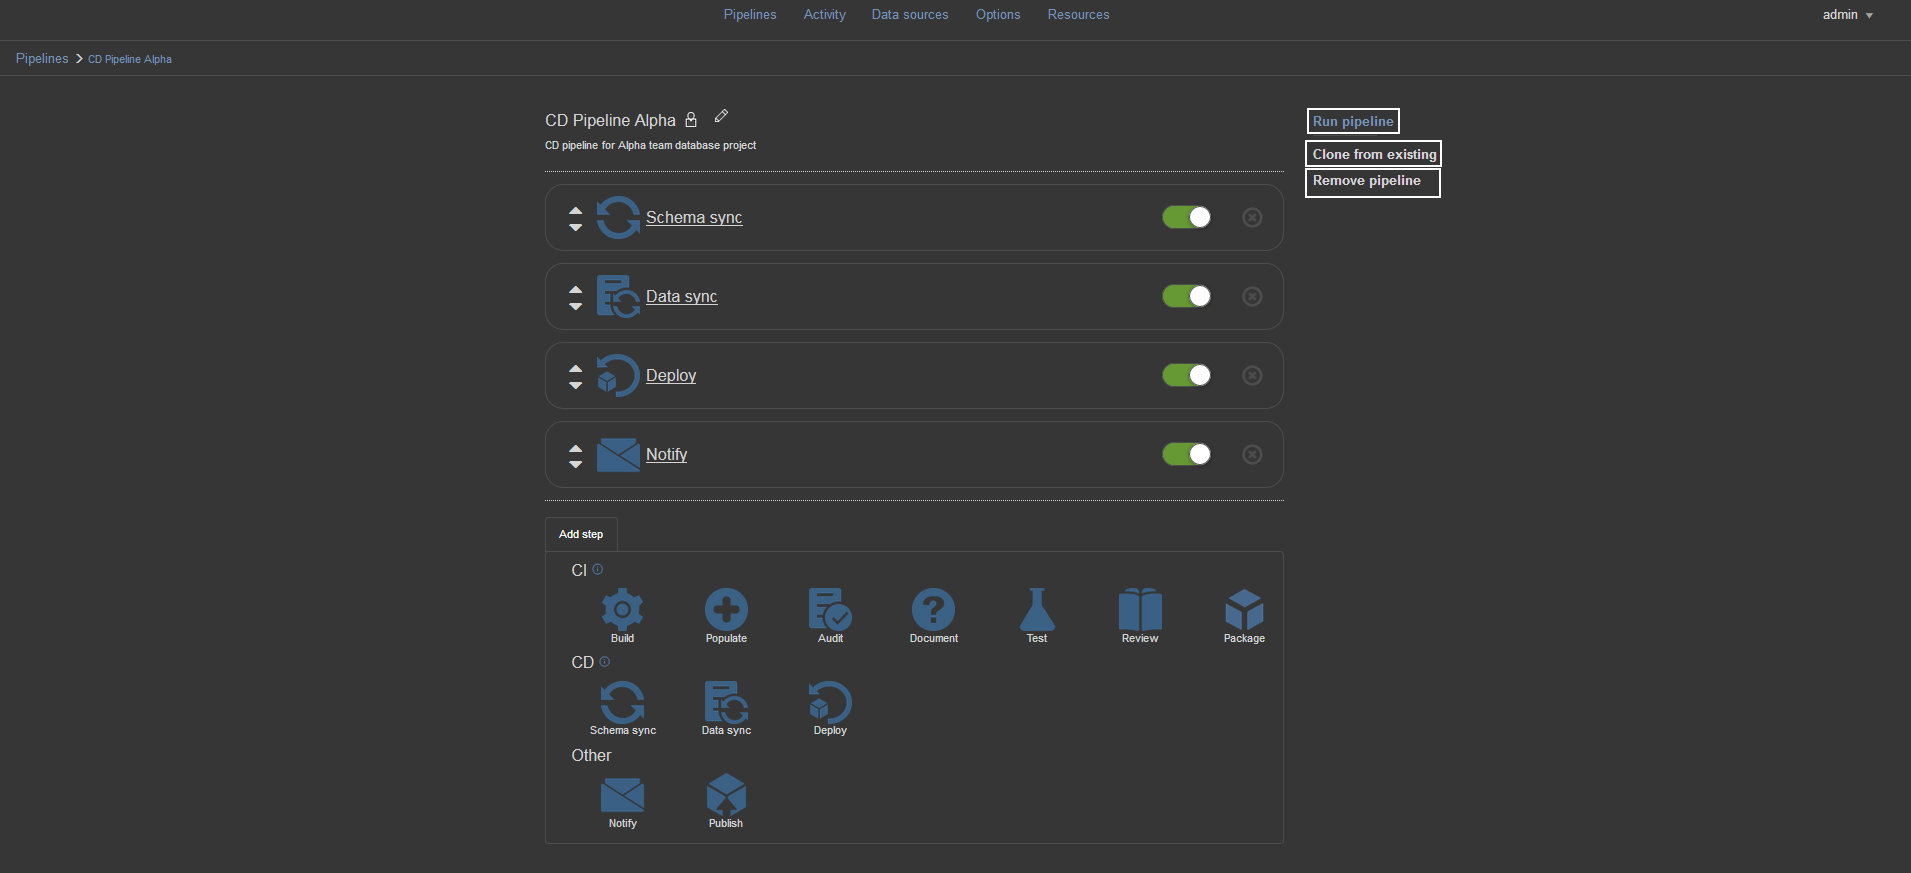
Once confirmed with the Create button, the main pipeline configuration view will open. This view has two major sections; the upper section displays created steps for this pipeline with their execution status and summary; the lower section contains icons for the available steps, for the purpose of adding new steps.
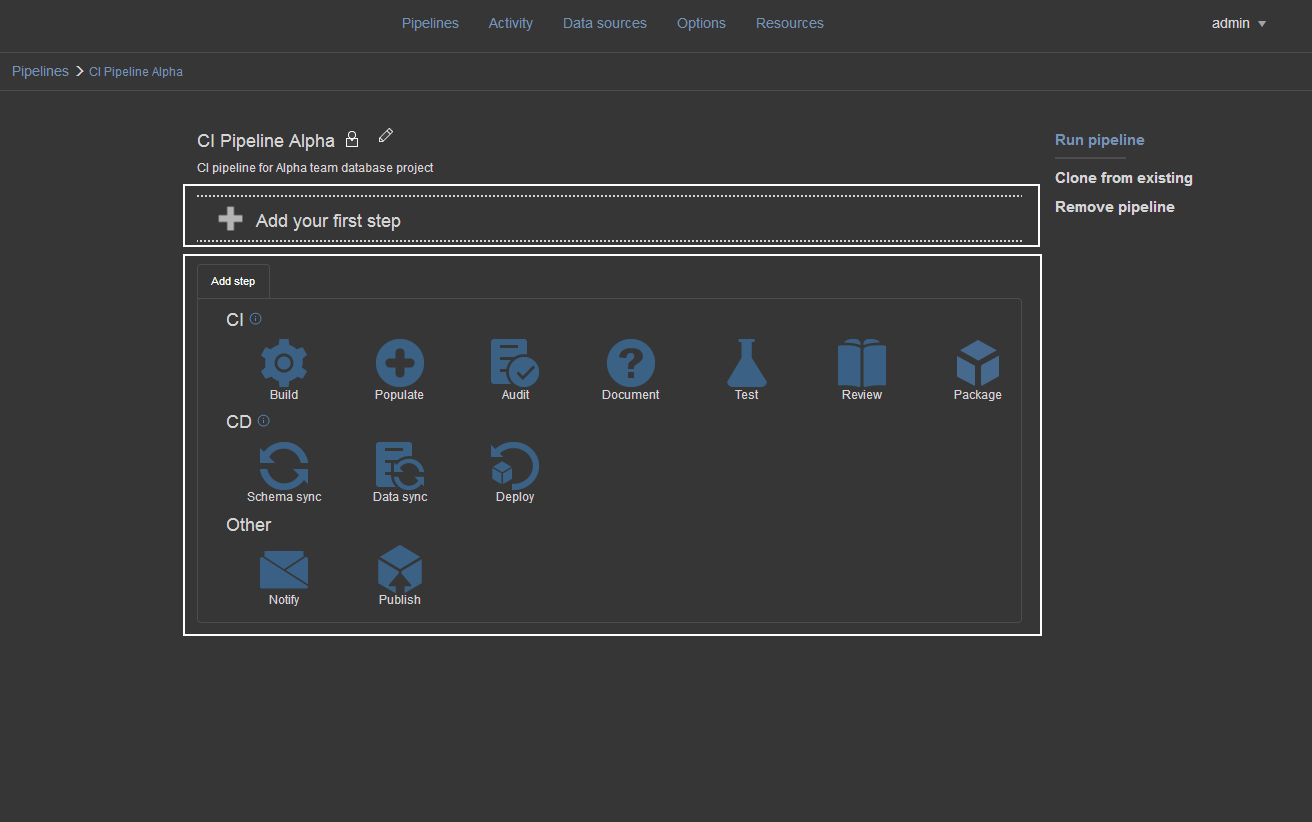
To add a step, simply drag and drop desired step icon from the lower to upper section of this view. After choosing, for example, the Build step, this step configuration view will be immediately opened.
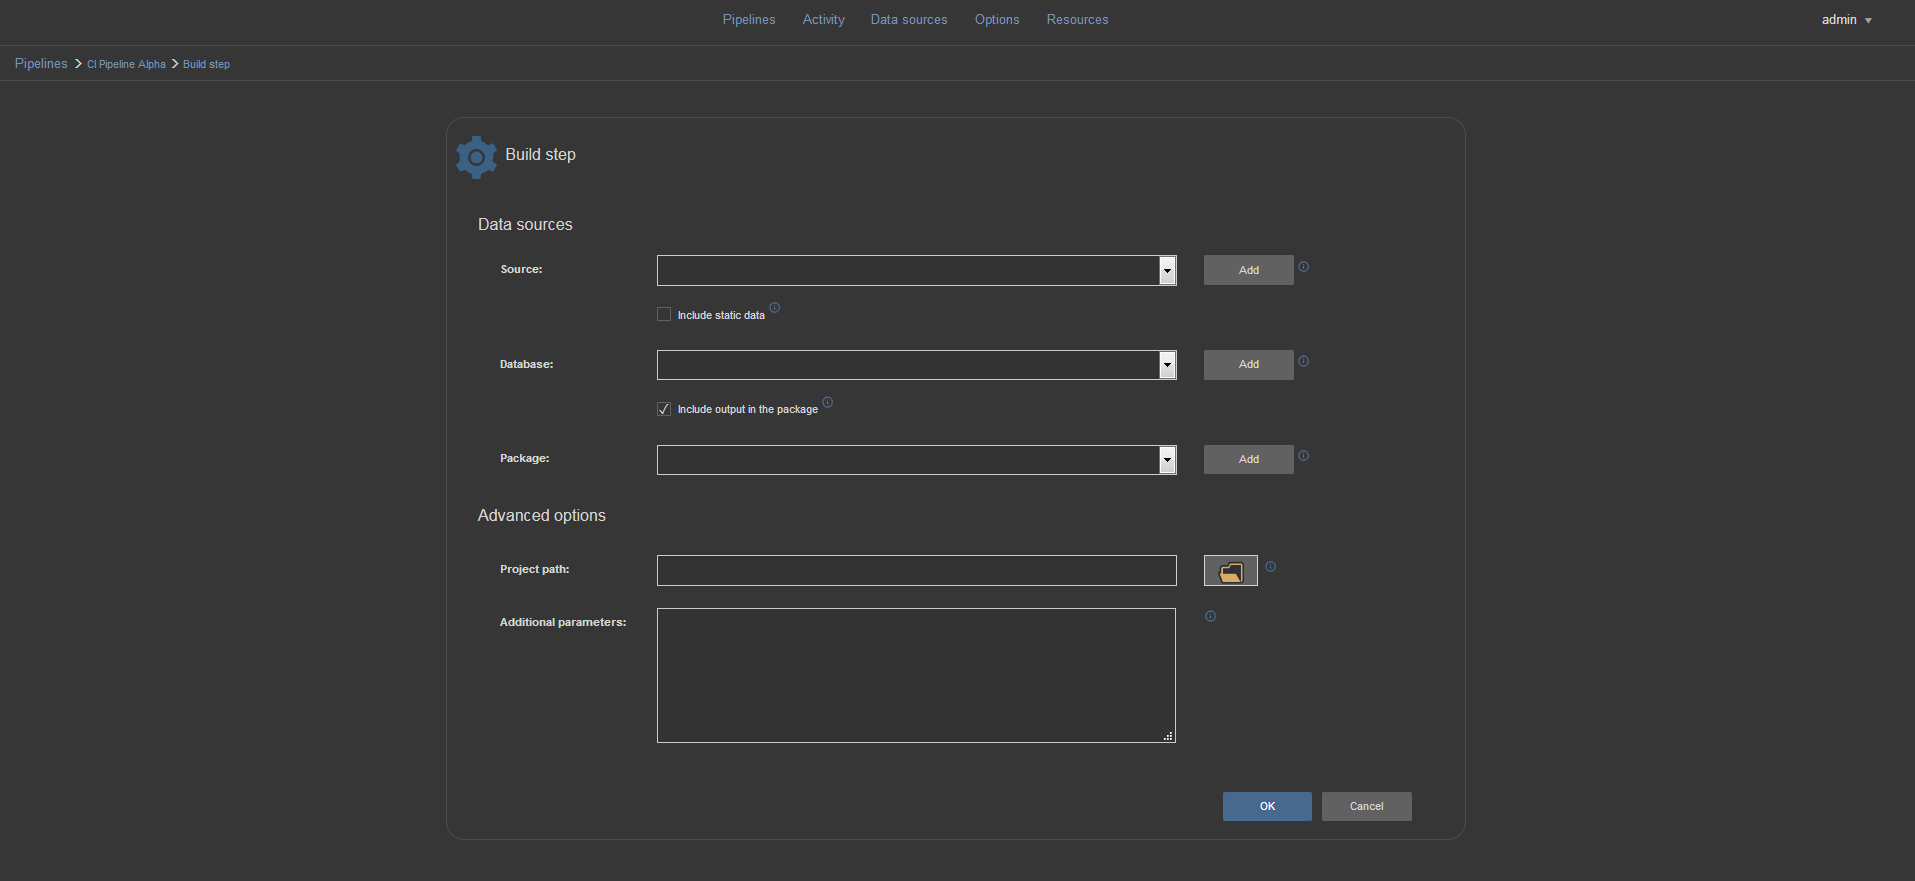
Most of the available steps have designated fields for selecting data sources, adding previously created project files and defining additional parameters.
Project files are a convenient way to import a pre-defined set of options, created and saved from an ApexSQL tool like ApexSQL Diff.
Data sources take precedence over project files for data source information and will displace any database or credential information stored in projects.
Additional options are CLI switches and values that will override any default automation behavior e.g. verbose of the toolkit and also any options that are supplied via the project file.
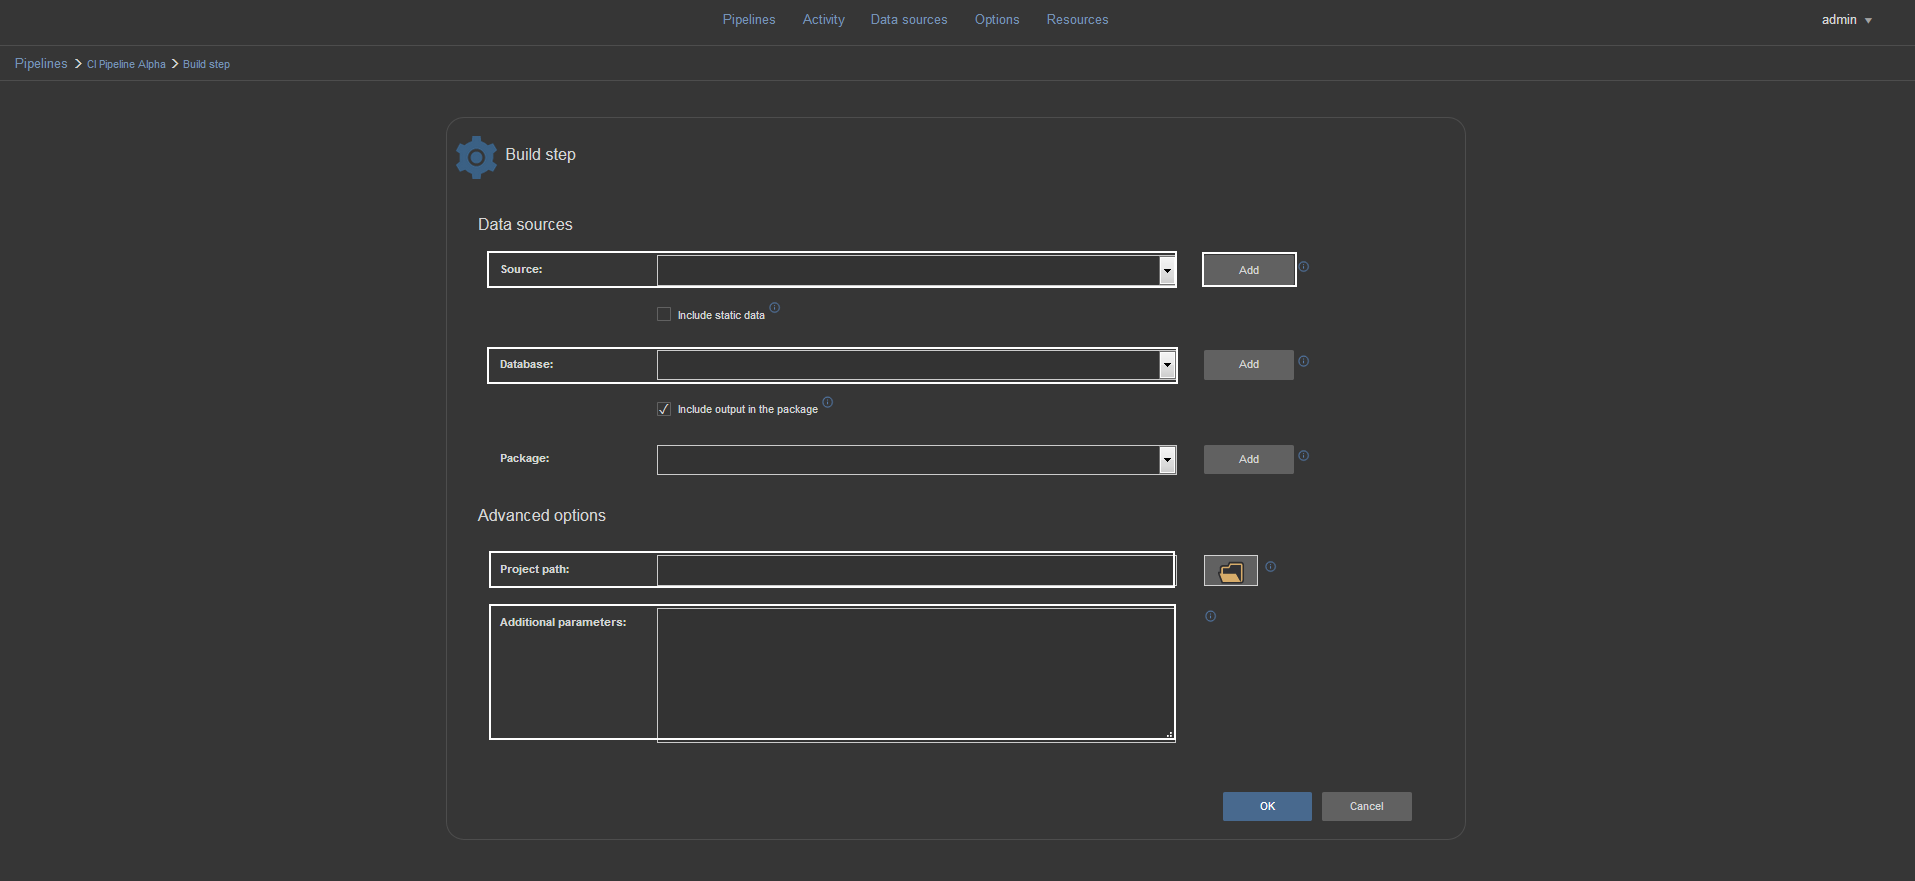
There is an option to Include output in the package. When selected, the output files like summaries, reports and scripts will be included in a NuGet package. Also, if the desired data source was not already created, a new data source can be created from step configuration with the Add option.
As an example, for the Build step, choose from the Source dropdown selection menu a data source that is the Source control type for building. In the Database dropdown menu choose the destination database to build from source control. Select “Include output” in the package and from the Package dropdown menu pick package type data source.
Besides the usual set of options, some steps have specific options.

When the step is configured, save it with OK button and the view will switch back to pipeline configuration view with new step shown in the upper section.
After the pipeline has been finished and all steps created, the pipeline steps can be reordered, removed, edited and/or disabled.
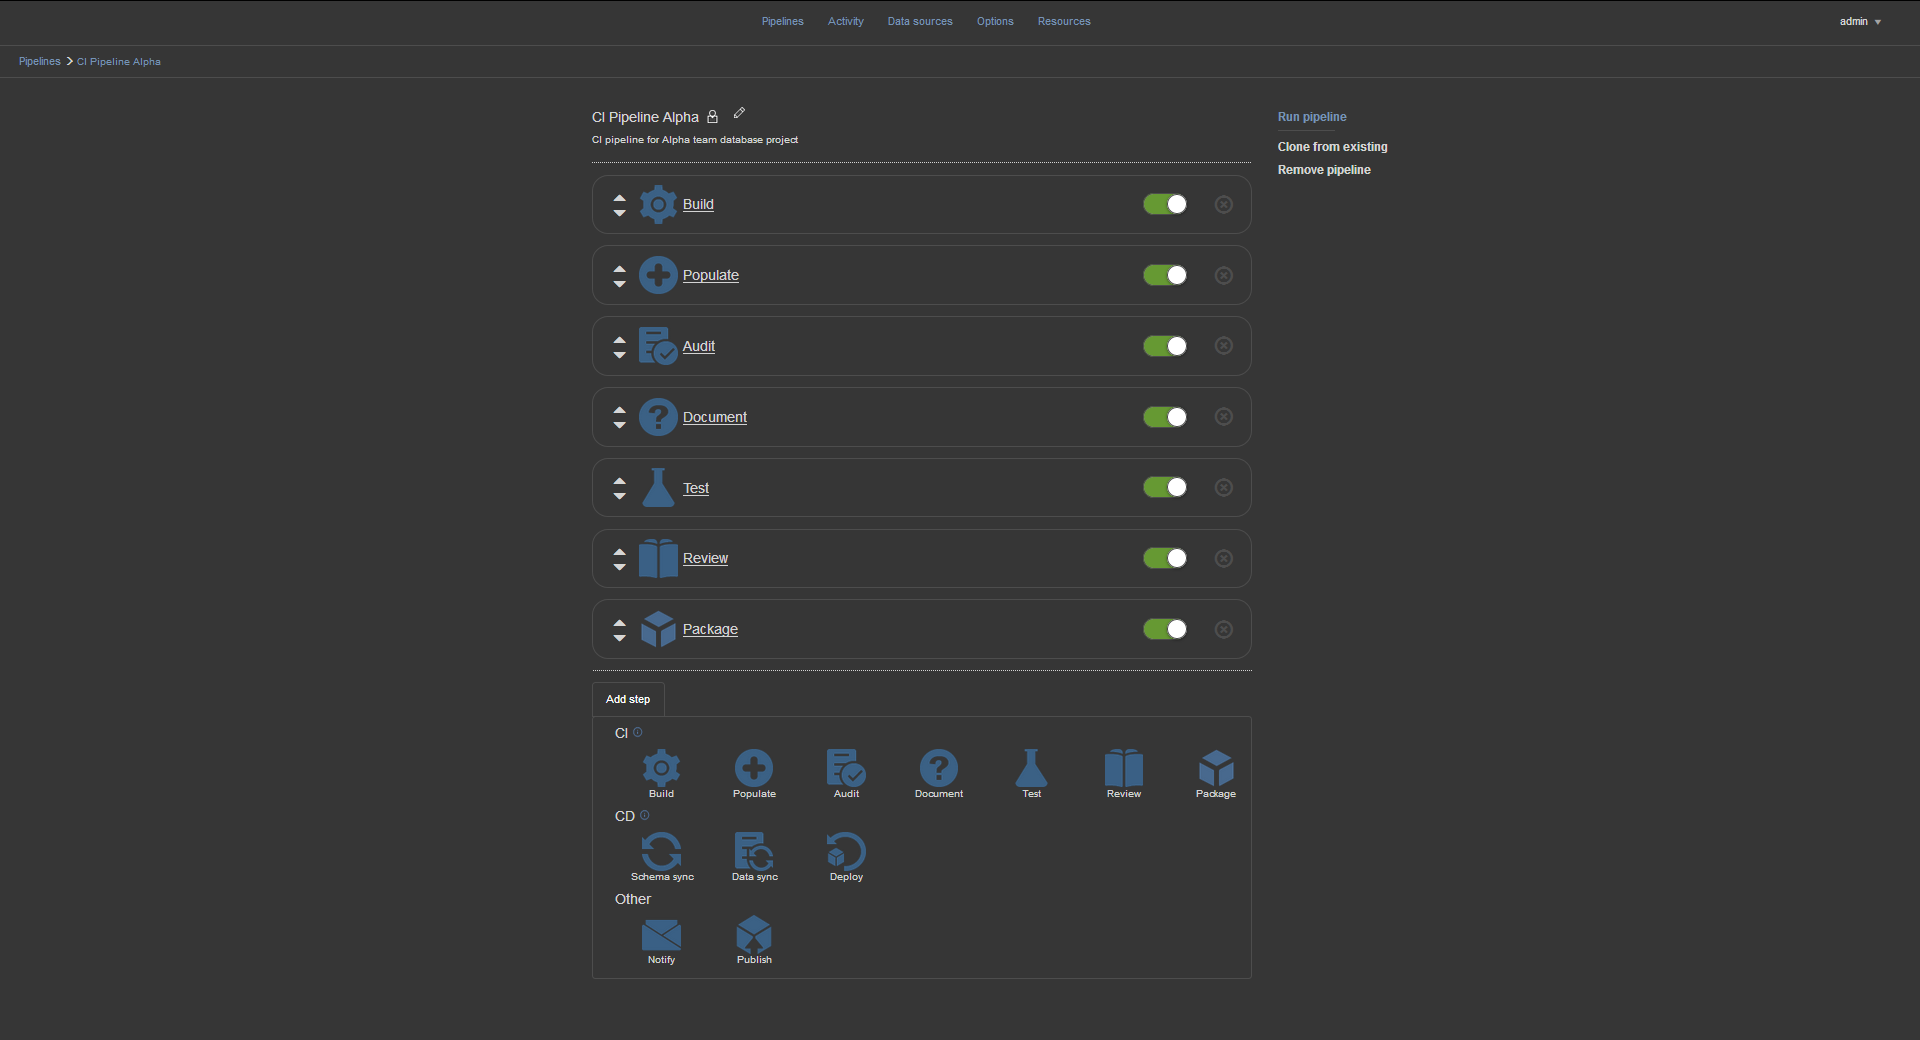
The completed pipeline can be executed manually with the Run pipeline option. While executing, every step will display its execution status and summary.
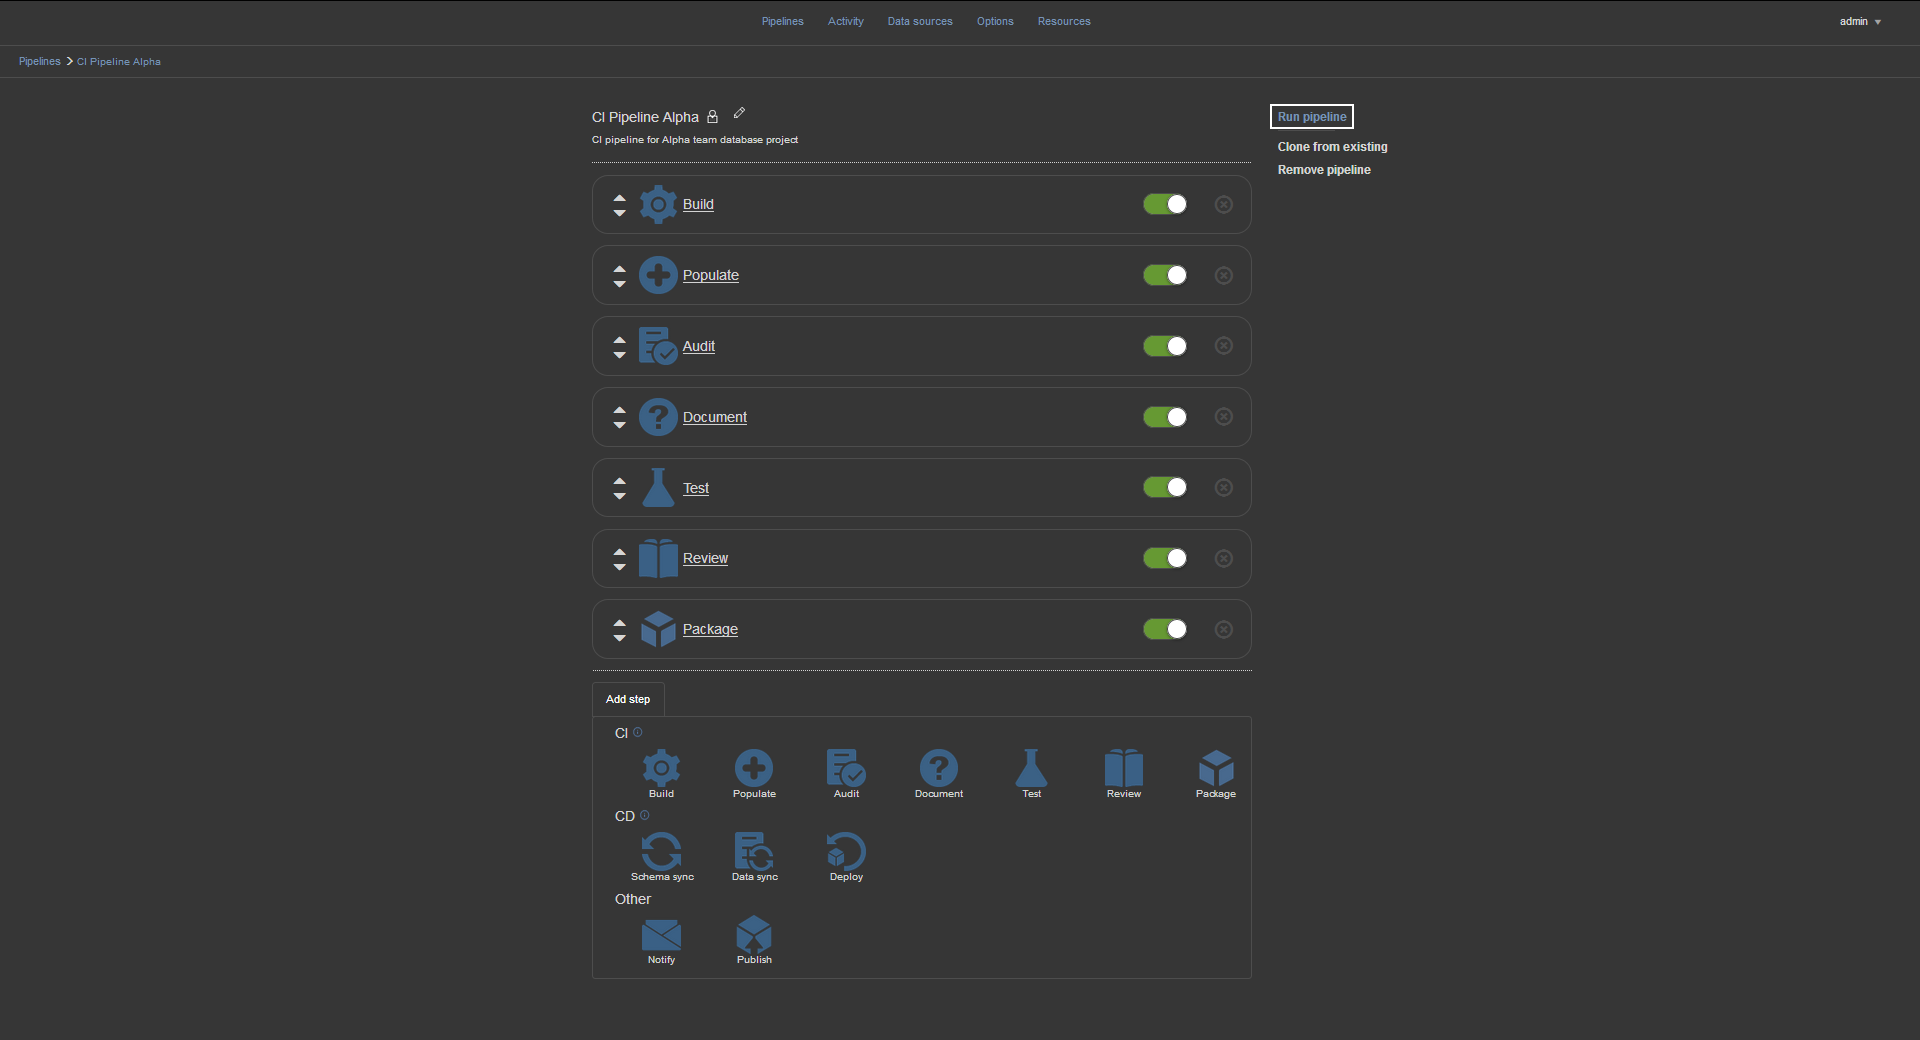
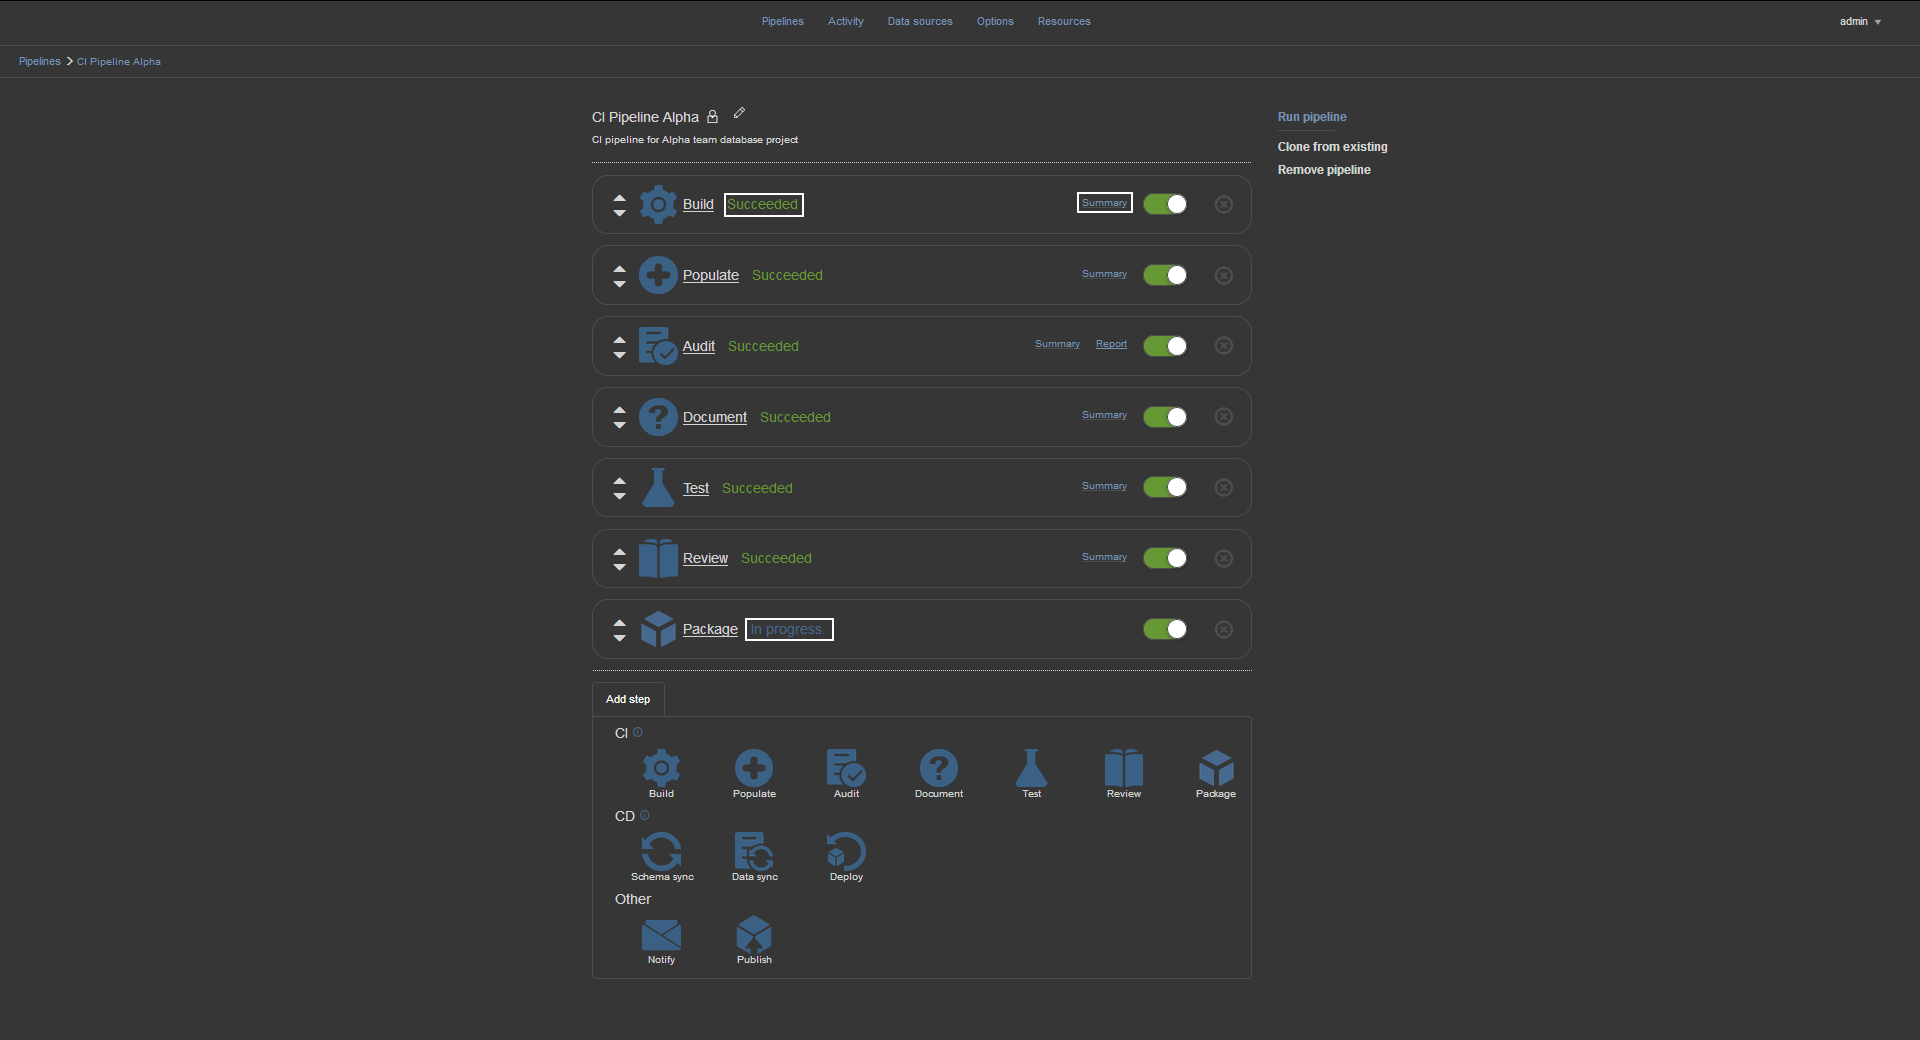
There are some additional options in the pipeline configuration view. From this point it is possible to edit the initial properties of the pipeline. On the right there are options Clone from existing, Remove pipeline and Run pipeline. The Run pipeline option executes the pipeline manually overriding the initial trigger settings.
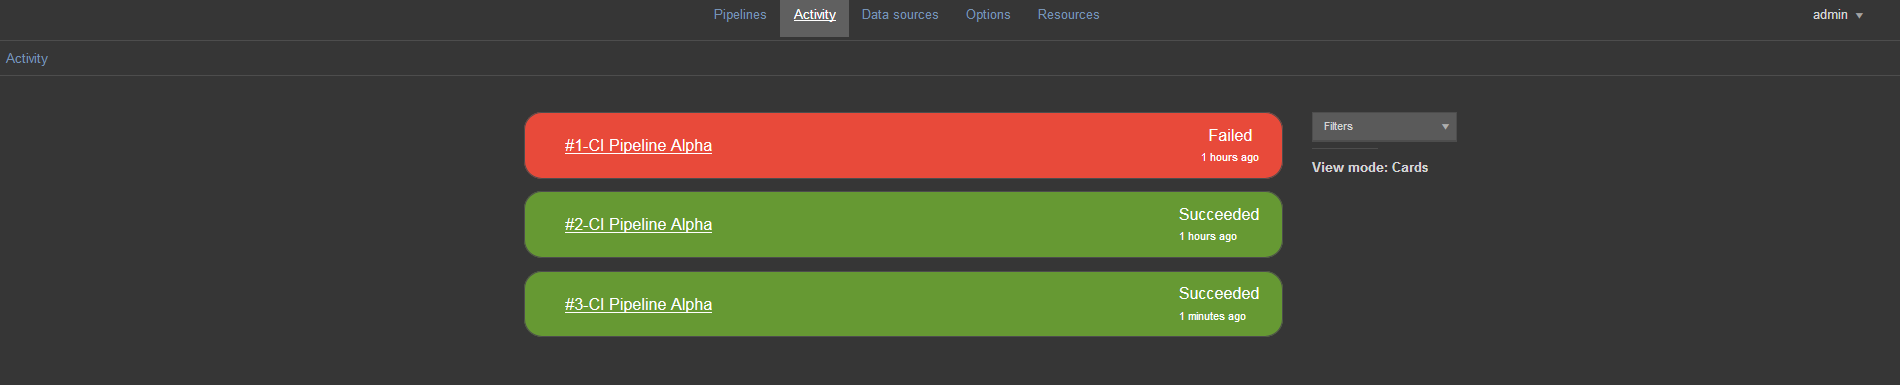
The next major Dashboard view is the Activity view.
This view contains an overview of the pipeline execution status history. Pipelines can be easily recognized by their names. There are also options for customizing this view. The filters option allows users to choose whether only successful or only failed executions will be displayed. “View mode” toggles between card and table views.
The Data sources view is very useful feature for organizing data sources. It shows all of the defined data sources with their designated name and type. From this view, users can edit existing or create and configure all of the data sources that are used throughout the various projects before using them in a pipeline. Options for this view are Create new, to add and configure new data source, View mode – to toggle the data source representation between cards and table and Sort – for sorting sources by name or by type.
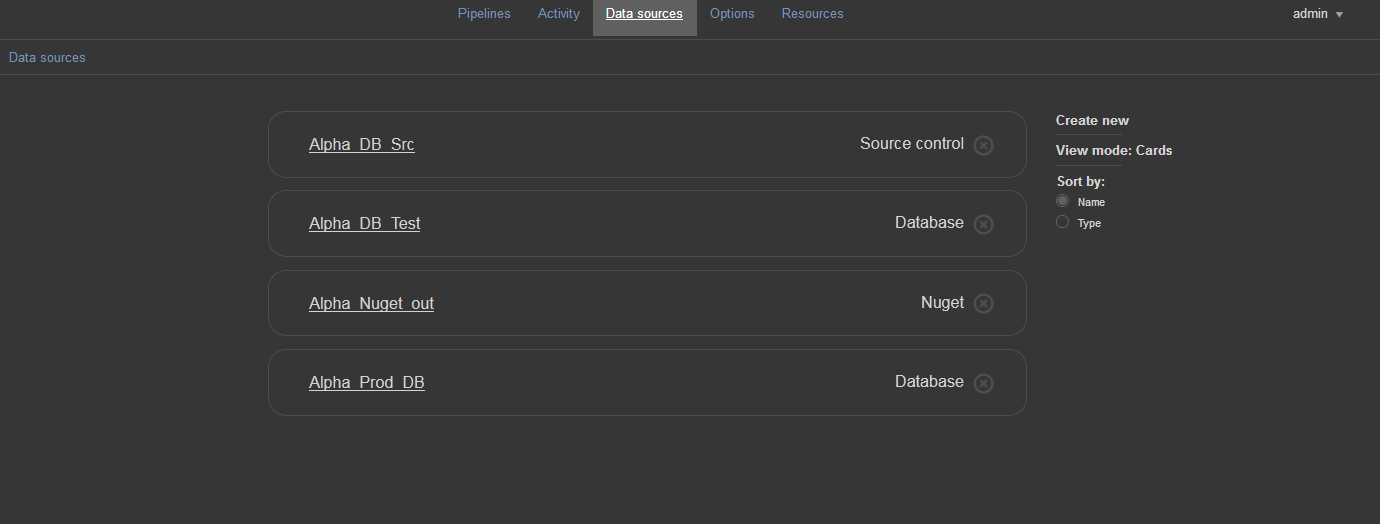
In the Create new data source view there are several data source types available:
- Database
- Source control
- SQL Script
- Script folder and
- NuGet
Data sources, once selected, can be configured. Click on the save button and the configuration will be permanently saved as data source and immediately available for future step configuration under the given name.

Next main view is the options view where users can set global options for the Dashboard. It consists of three groups of options.
The General options view has the settings for the output folder path, for the step execution output, and the project folder path where saved projects from ApexSQL tools are stored. Other options allow users to configure visual styles, to manage defaults

The Notification options is where the outgoing email account has to be set up in order to send pipeline execution notifications.

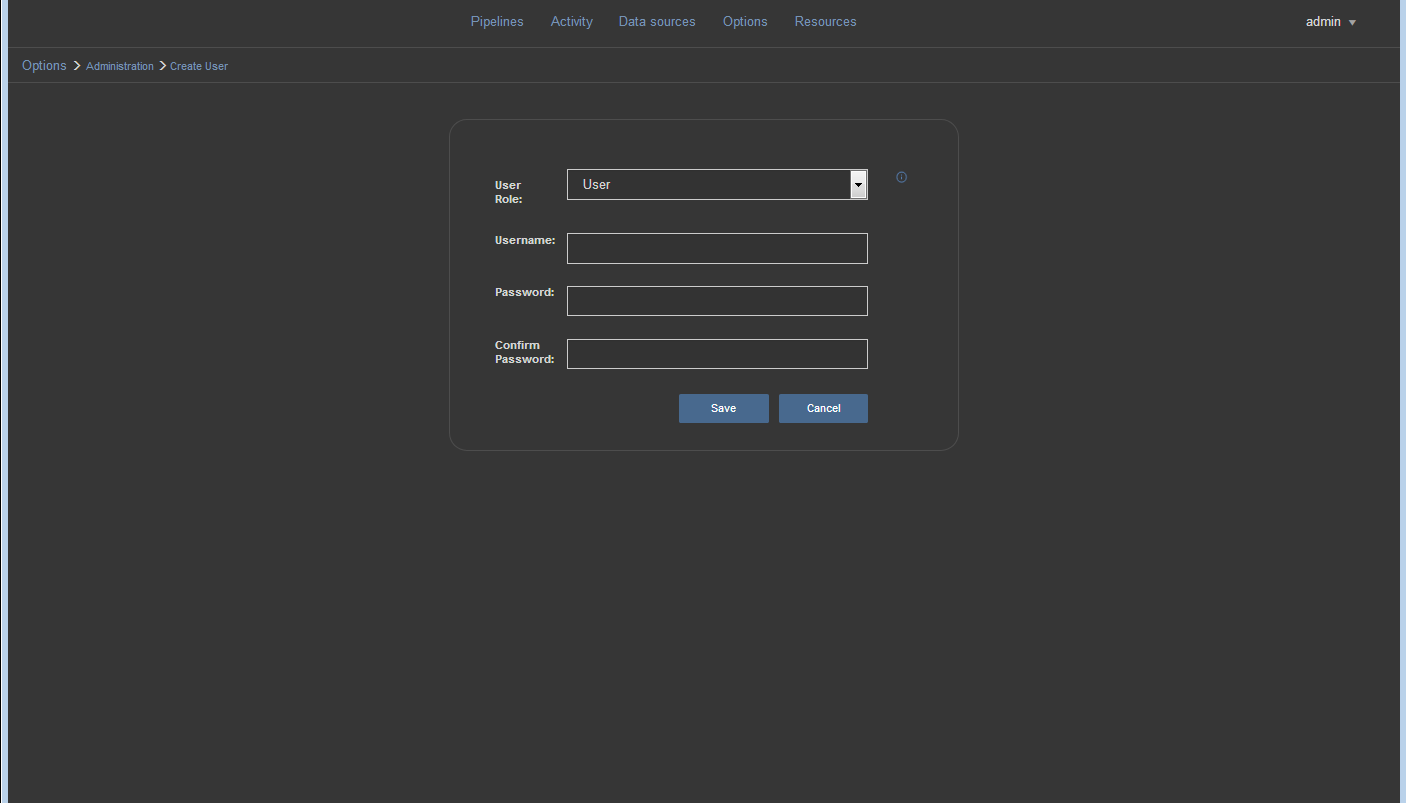
Administration options provides the list of users that have access to the Dashboard with their assigned roles. To edit user settings, click on the card representing the user. The users for accessing the Dashboard can be created using the Create New User option. Plain user or administrator roles can be assigned to every user. Every user can access pipelines and data sources that were created by that particular user.
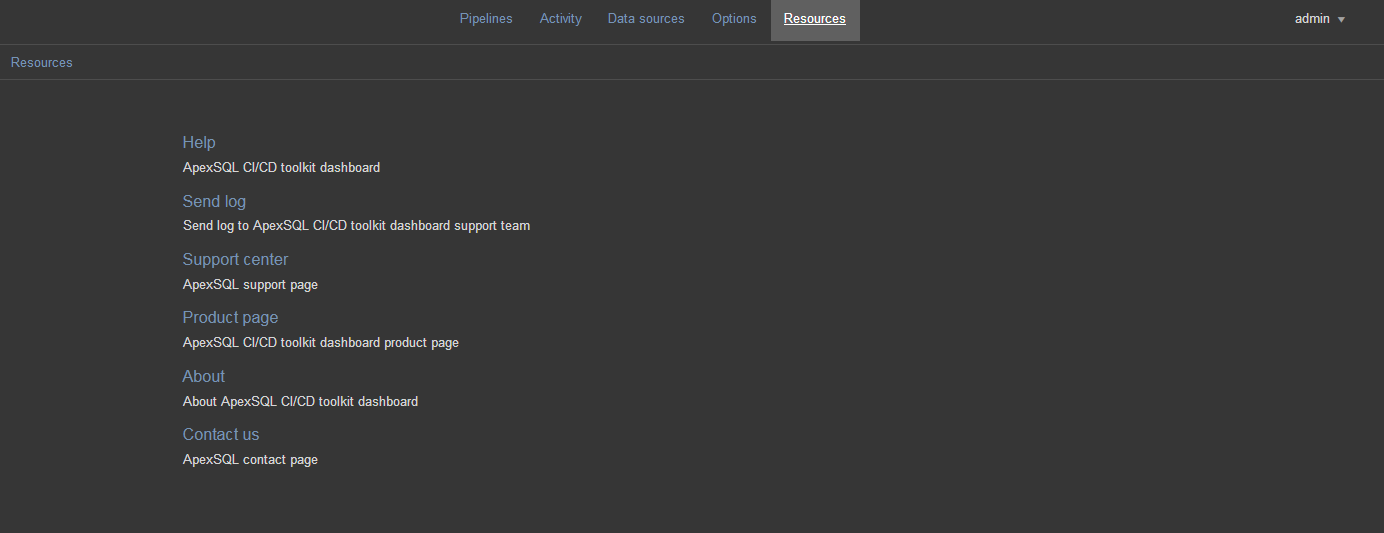
In the Resources view can be found helpful options for contacting ApexSQL support and for accessing general information and help about the product
This concludes the overview video of the main views of the ApexSQL DevOps toolkit – Web Dashboard.
Thanks for watching. For more information, go to apexsql.com
See more:
An introduction to ApexSQL DevOps toolkit Web Dashboard – pipeline steps overview