This video shows how to start using ApexSQL Analyze.
Transcript
Hello, and welcome to this ApexSQL Analyze DEMO introduction. ApexSQL Analyze is a simple yet powerful developer tool for SQL Server database dependency analysis. ApexSQL Analyze enables users to analyze and graphically review object dependencies inside SQL Server databases, and create custom visualizations. In addition, ApexSQL Analyze can be used to export database dependency diagrams into various image formats such as JPG, PNG and BMP format.
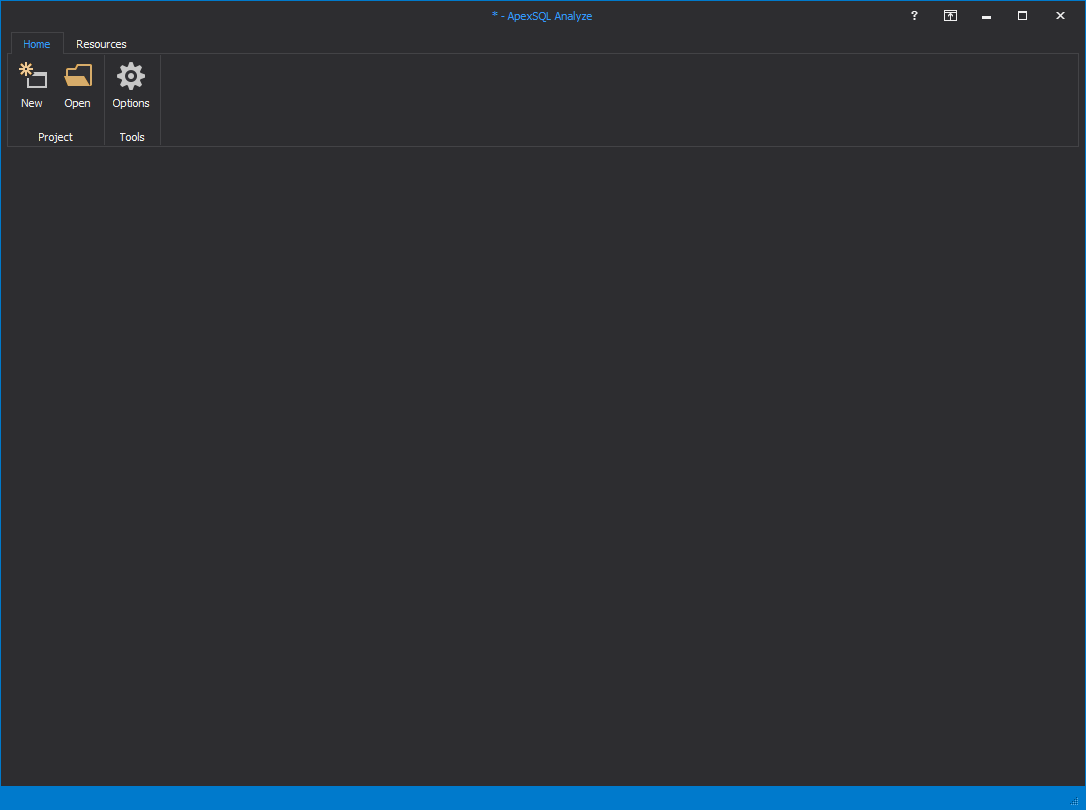
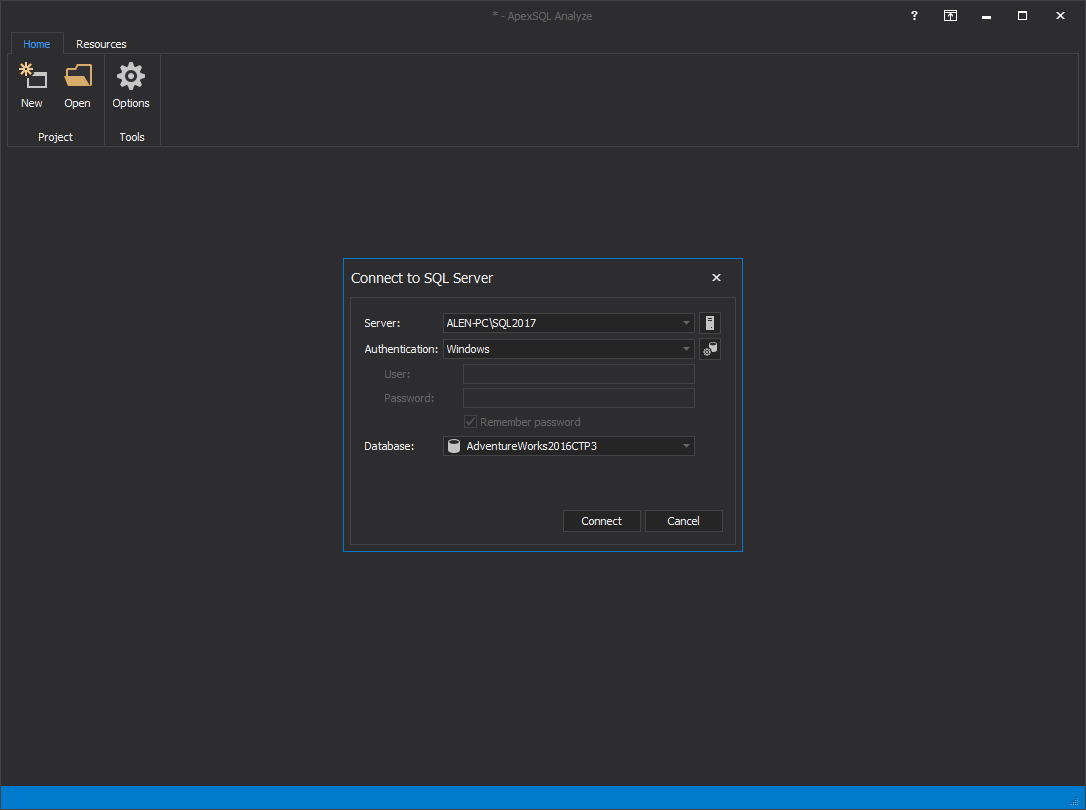
In order to analyze a database to determine object graphical dependencies, a new project needs to be created, by clicking the New button. Once clicked, the database connection dialog will appear, where the desired database can be selected.
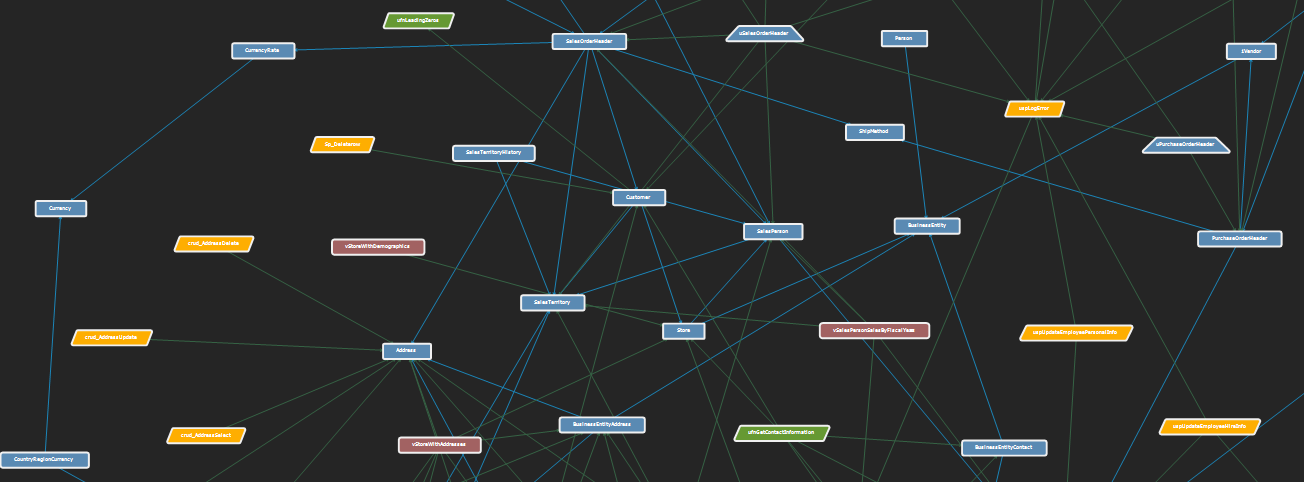
Once a database has been selected for analysis, it will be parsed by the dependency explorer engine and graphically represented, showing all object dependencies inside the selected database.
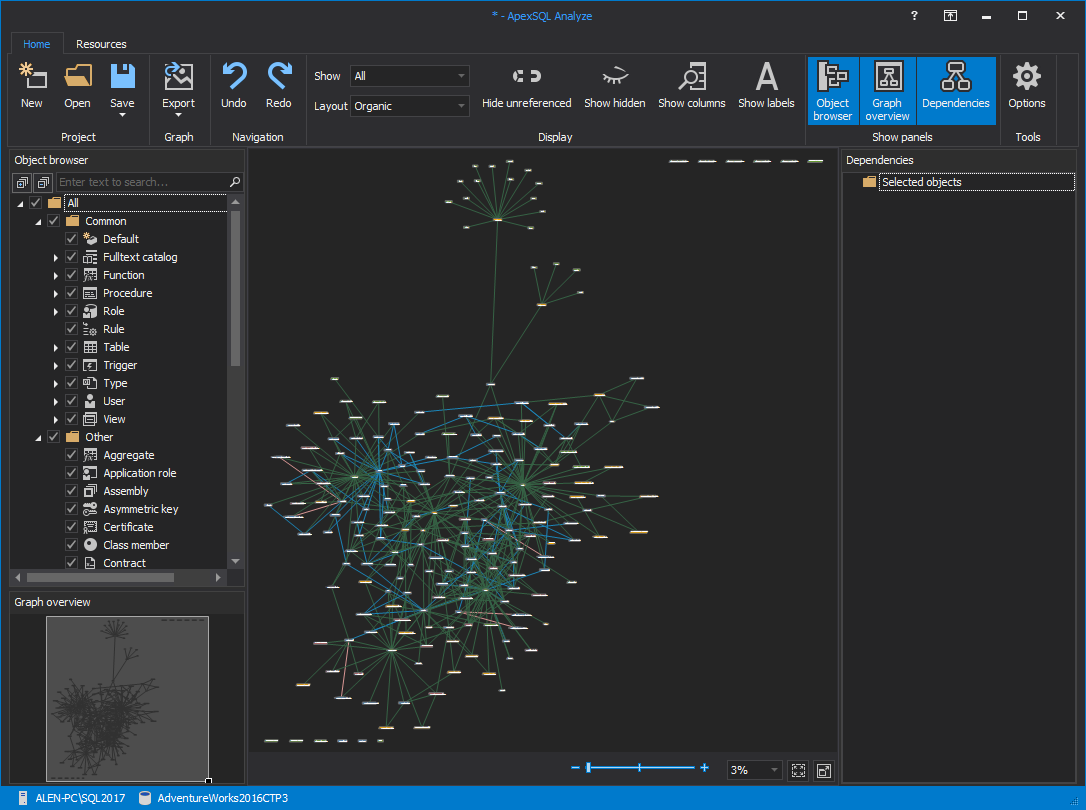
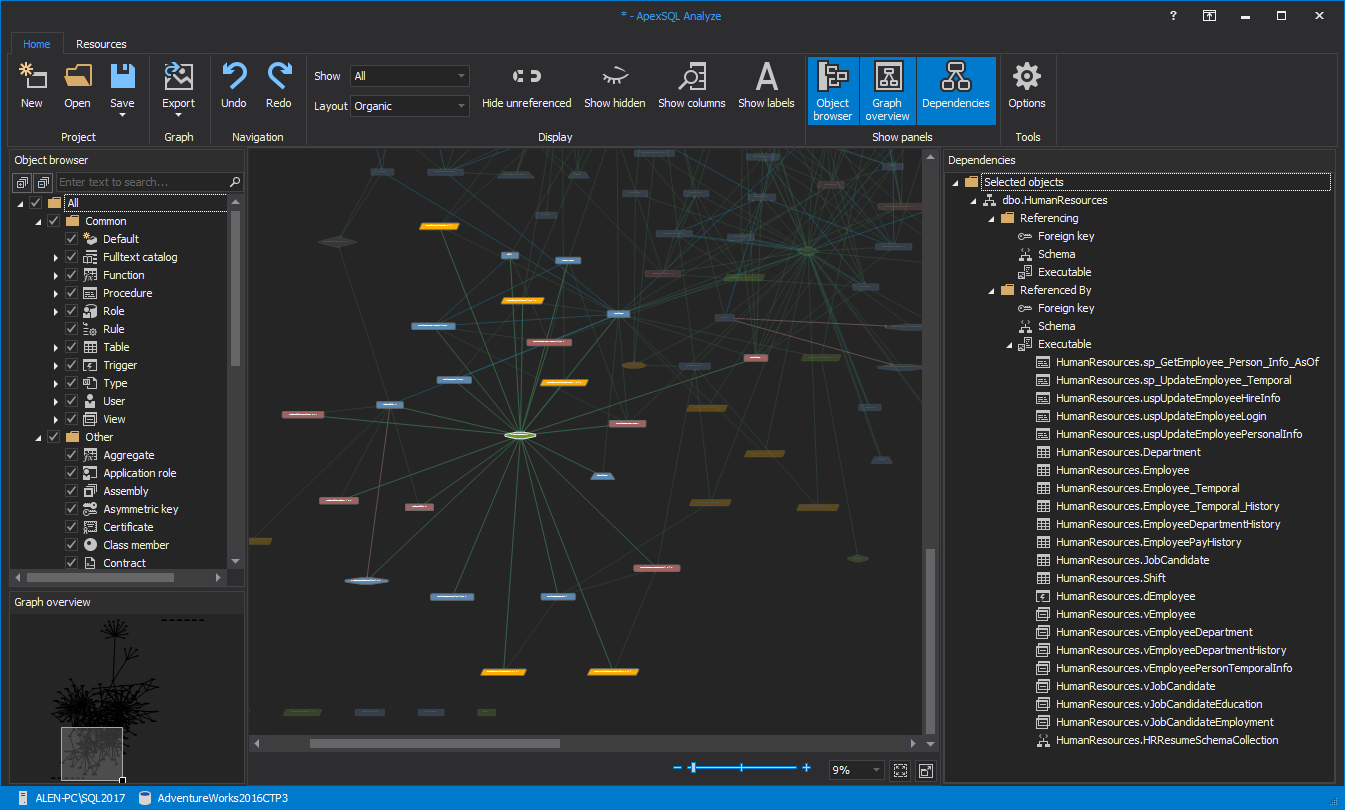
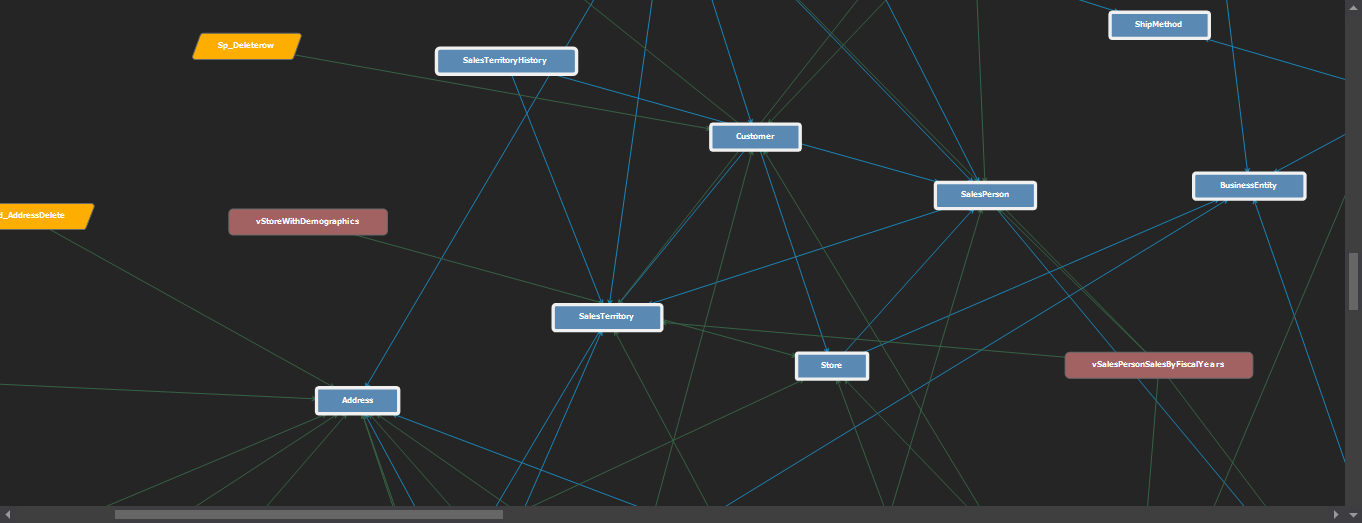
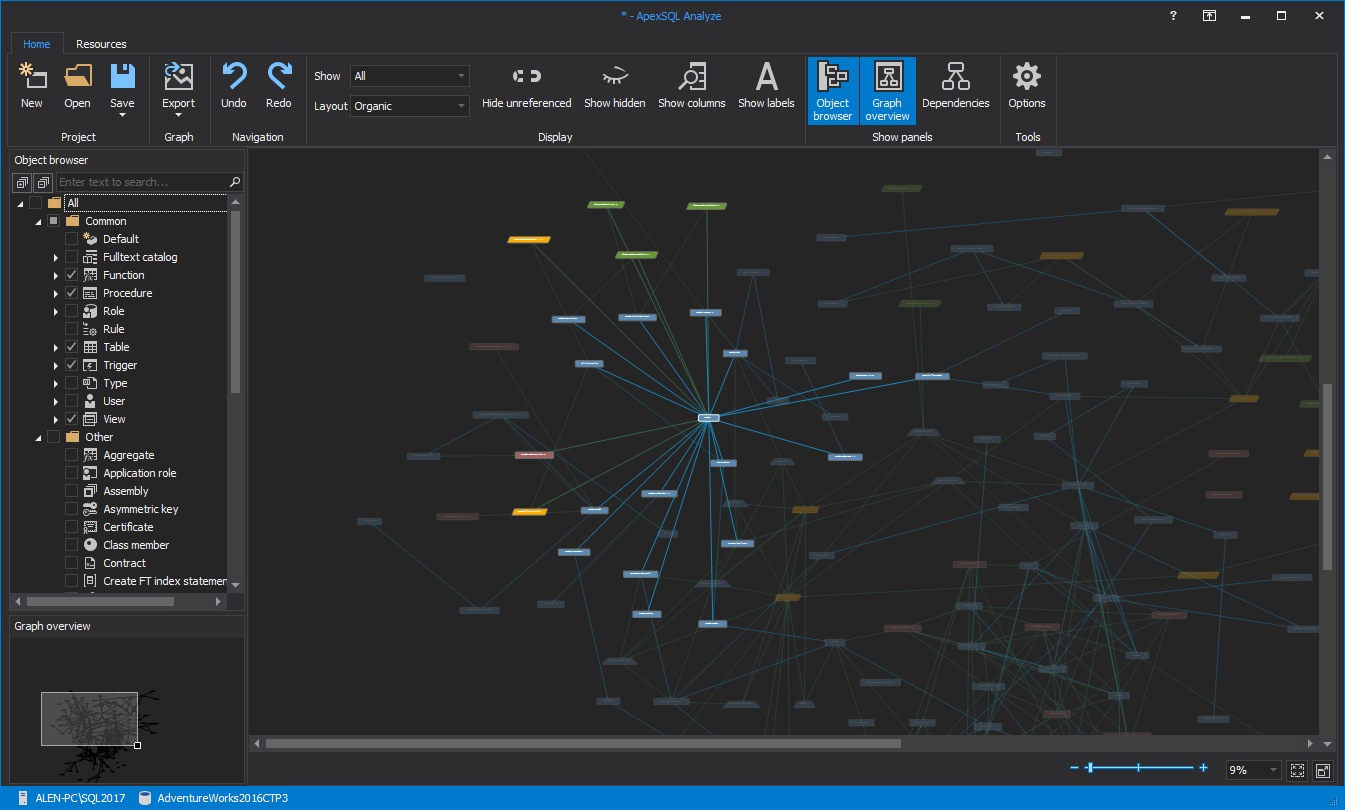
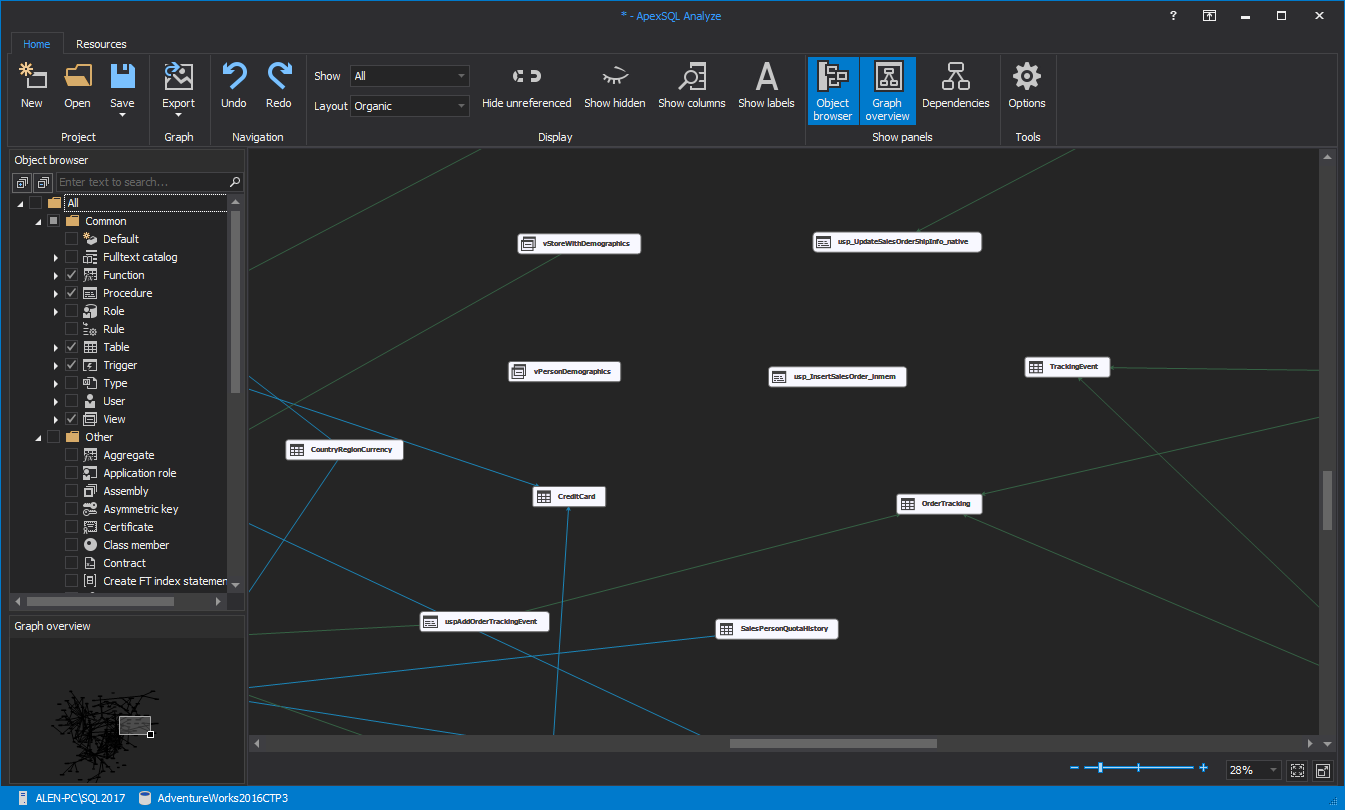
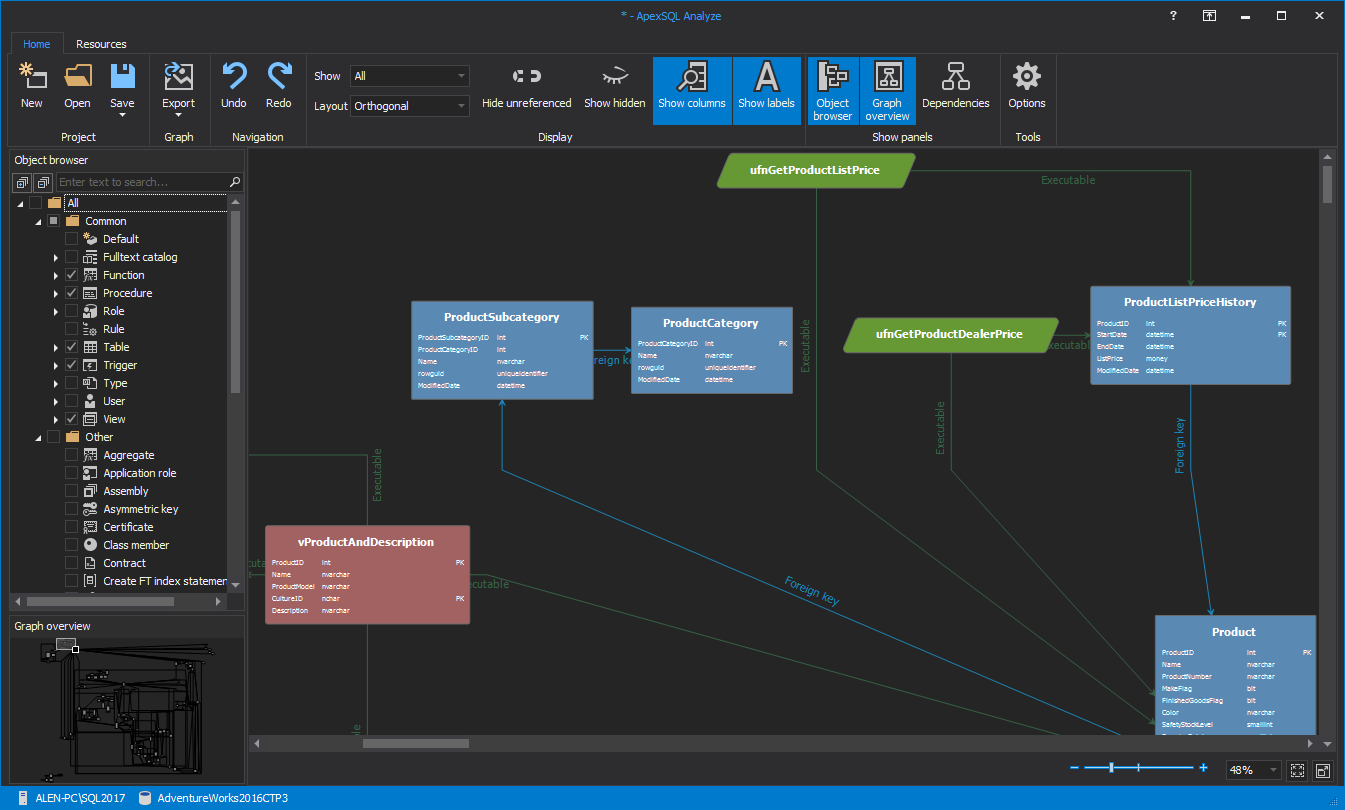
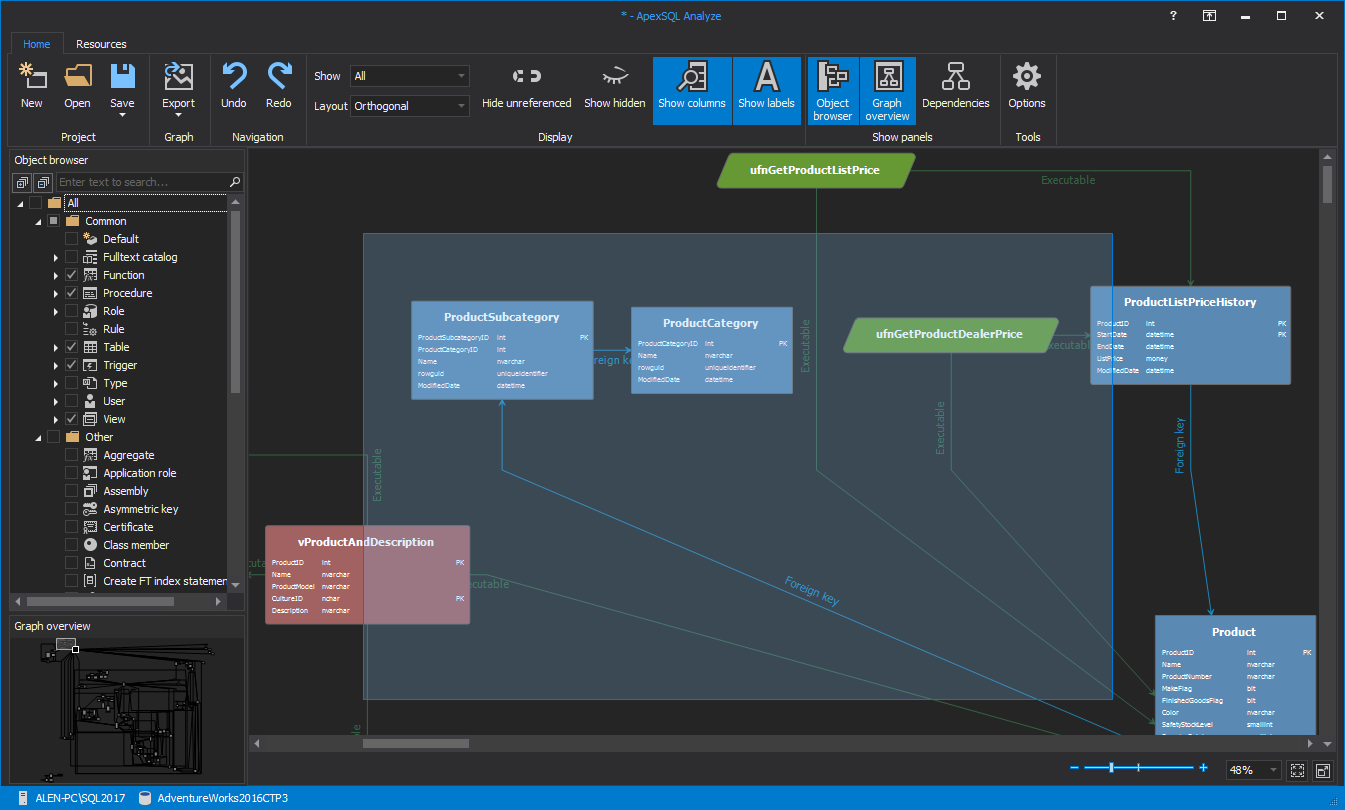
The main window of ApexSQL Analyze offers a view of the created graphical dependency diagram, with navigation, display and layout options and panels that can be toggled on or off.
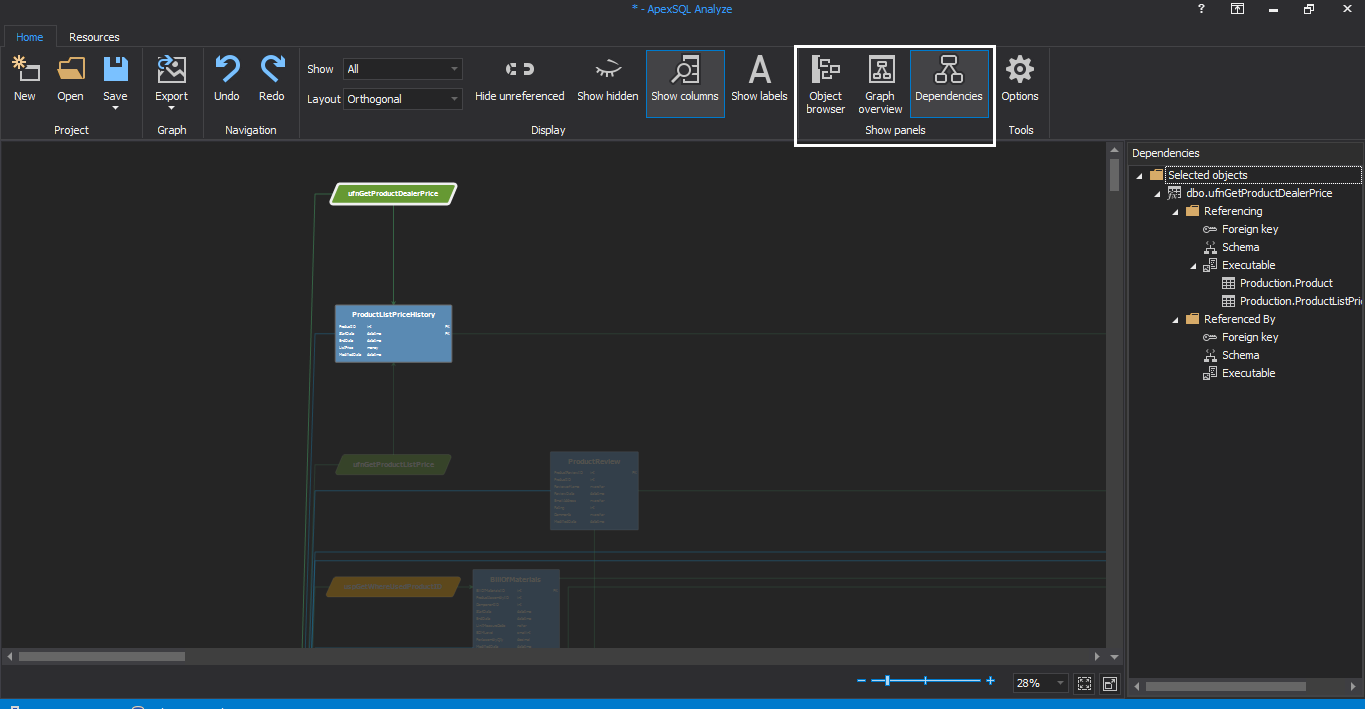
Once a database dependency diagram is created it can be analyzed by selecting the desired objects and their dependencies will be highlighted on the main view area, as well as in the Dependencies panel on the right.
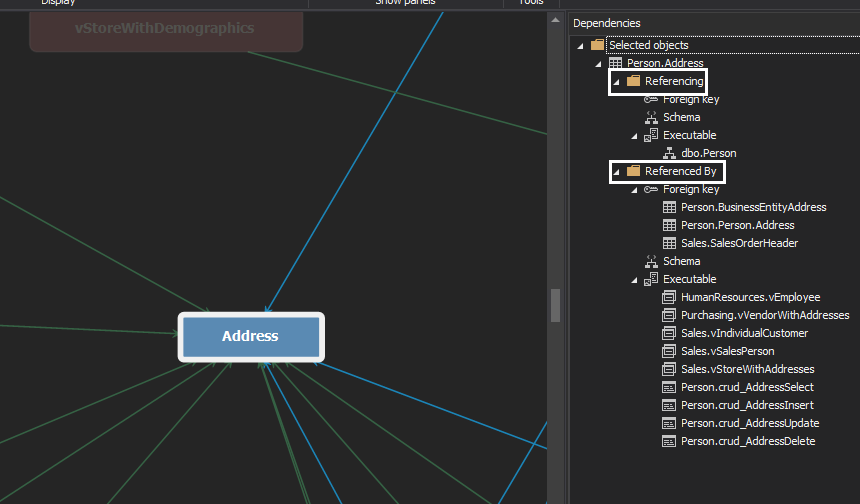
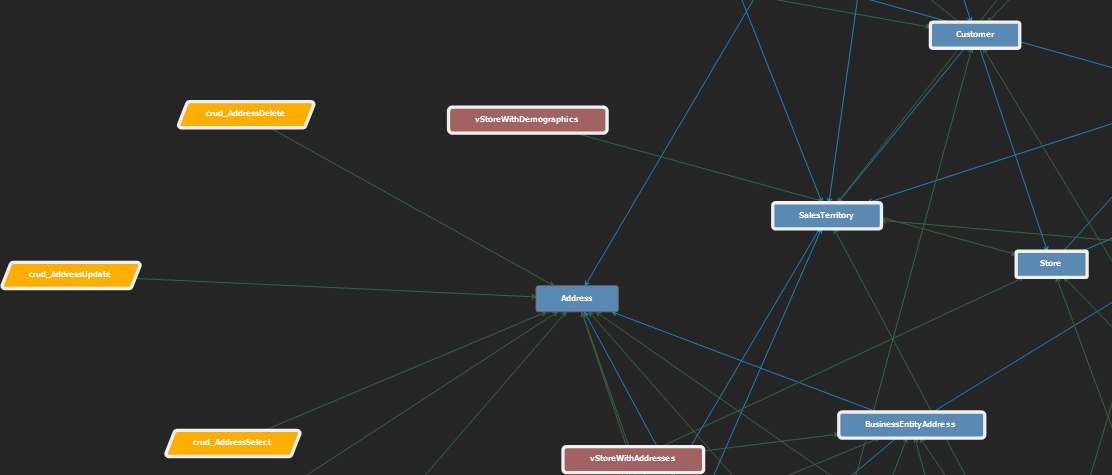
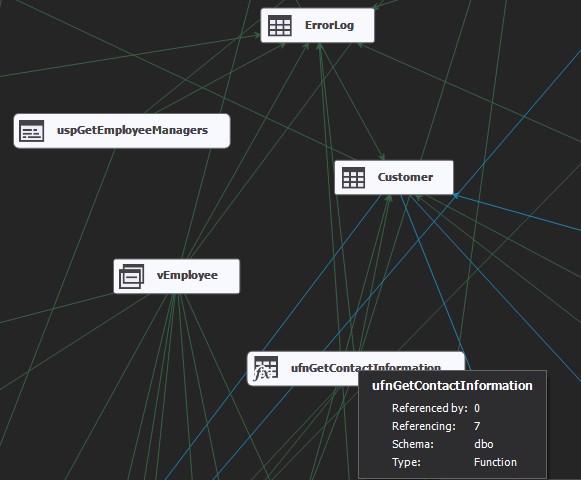
The complete dependency chain for the selected object in the dependency graph for example the Address table can be shown. Referencing indicates the object that depends on the selected object and Referenced by shows the objects from which selected object depends on
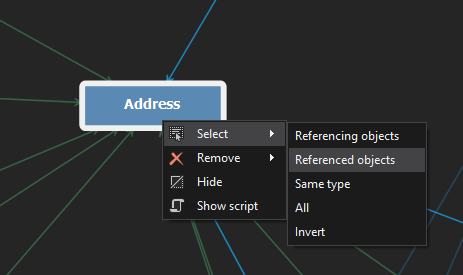
Also, the dependency chain can be reviewed by selecting an object in the dependency graph. To do this, right click and from the context menu under the Select sub-menu, choose the Referencing objects or Referenced objects items
Besides selecting Referencing and Referenced objects under the Select sub menu you can select all objects with the same type as the currently selected object.
For example, in the Dependency explorer we have selected the Address table
Now, when we use the Same type command
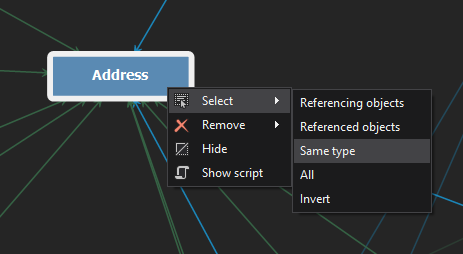
all objects with the type, a table in this case, will be selected in the Dependency explorer
The All command is for selecting all objects in the Dependency explorer at once
The Invert command, as you would imagine, will invert the selection of the objects.
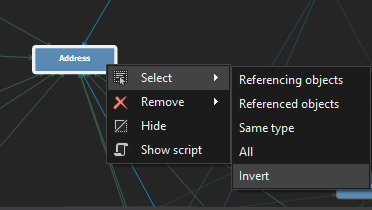
For example, we have selected the Address table in the Dependency explorer, but now when use the Invert command, the Address table will be unselected and all other objects in the Dependency explorer will be selected
For easier analysis and faster filtering of desired objects, the Object browser on the left side of the application, can be used. Only selected object type categories will be shown which helps by narrowing down the visible object set to allow for focus on particular objects and relationships.
For example, tables, views, procedures, triggers and functions as demonstrated
The Dependency explorer feature of ApexSQL Analyze also allows you to customize and design the overall appearance of the dependency diagram.
The Dependency explorer feature provides the following customization capabilities:
- Layout editing including moving nodes, resizing nodes and clusters, and selecting the layout mode
- Selecting the layout style between shapes, colors and icons
- Zooming, scrolling, fit to window and full screen mode
- Creation of custom graphs including the manual definition of object positions
To select multiple objects that need analysis, click the object to select it. Pressing and holding the Control button, then clicking alongside it will add the next selected object to the current selection if previously unselected or vice versa.
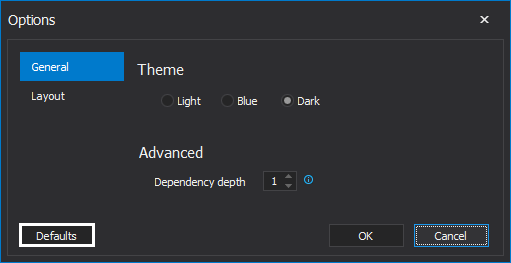
The dependency diagram object layout and style can be modified and adjusted using a few different options. The Style options are located in the Layout tab of the Options window
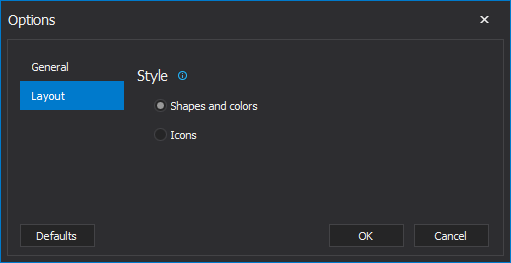
The Shapes and colors option
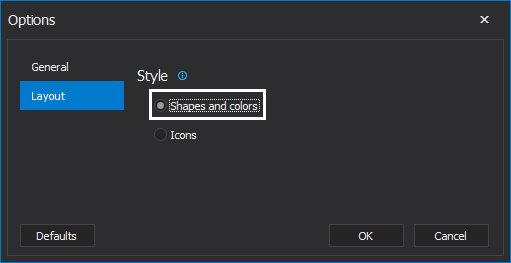
shows the objects in the dependency diagram using various shapes and colors for representing different object types.

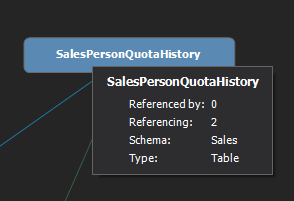
For example, a blue rectangle represents tables
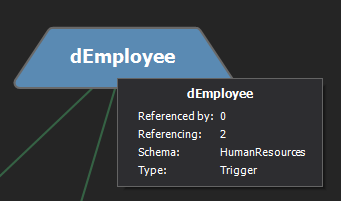
Blue trapezoid represents triggers
The Icons option
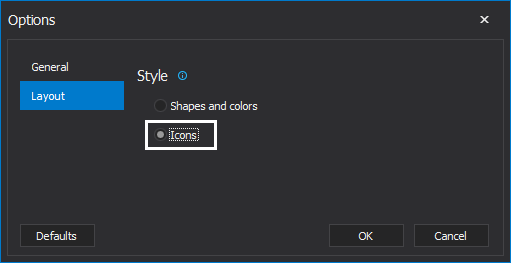
shows the objects in the dependency diagram using icons for representing different object types
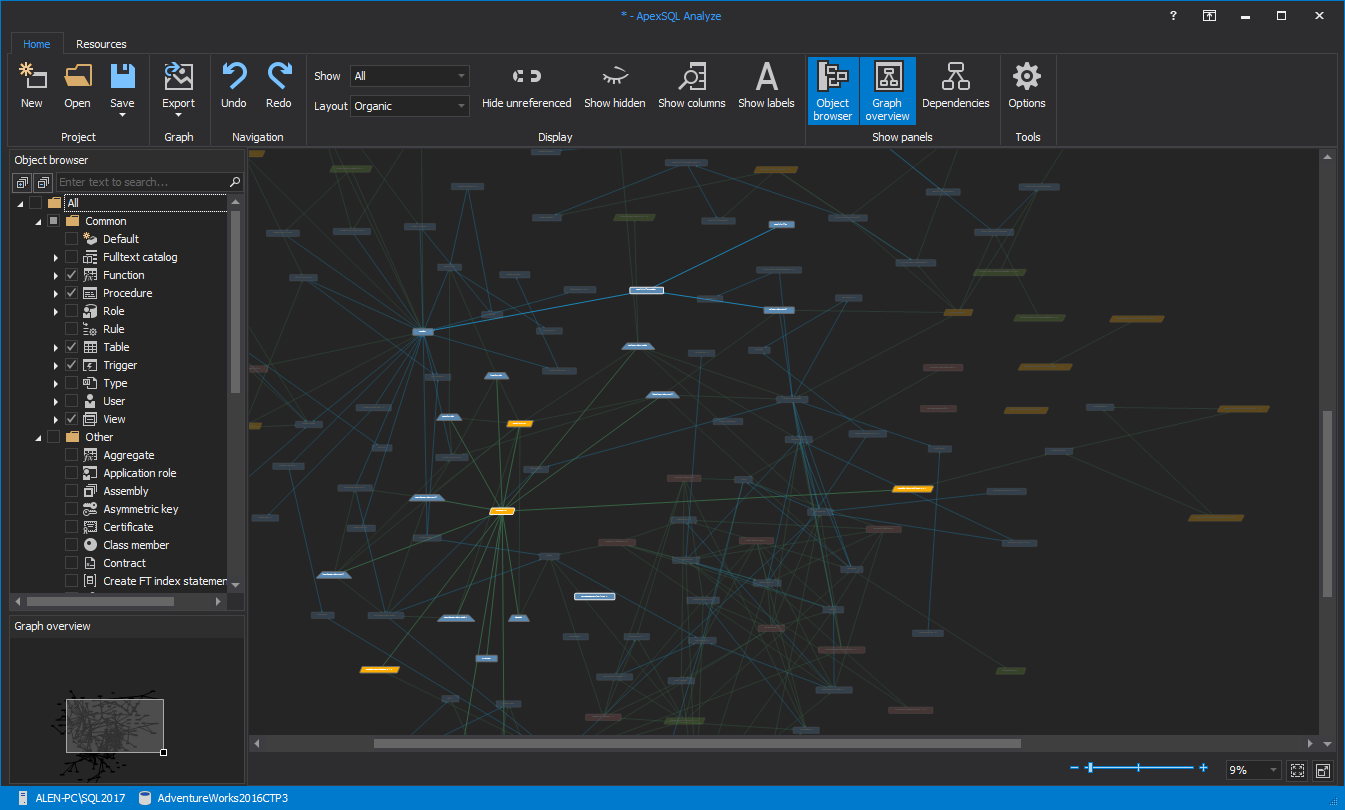
To customize the layout mode of the dependency diagram the Layout options from the main ribbon bar can be used. Each of the three Layout modes available, Organic, Circular, and Orthogonal can be used to modify the dependency diagram to the selected layout mode.
For example, the Orthogonal option attempts to organize objects in the diagrams so that they are at right angles to each other. It is useful for quick identification of all objects related to a given object, including both those that depend on it and those it depends on

Using these options, it can easily be determined how many objects depend on a specific object and a determination can be made as to whether it is safe to delete it without breaking relationships
The default settings for each instance can be restored by pressing the Defaults button in the Options window.
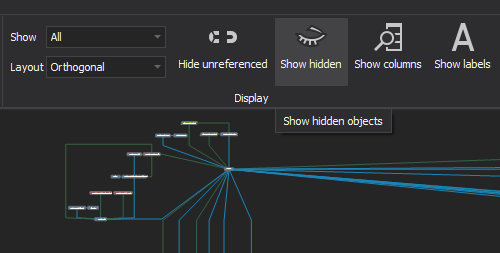
Other Display options are also available and can facilitate analyzing even the most complex databases. For example, all unreferenced objects can be turned off by clicking the Hide unreferenced button from the main ribbon bar.
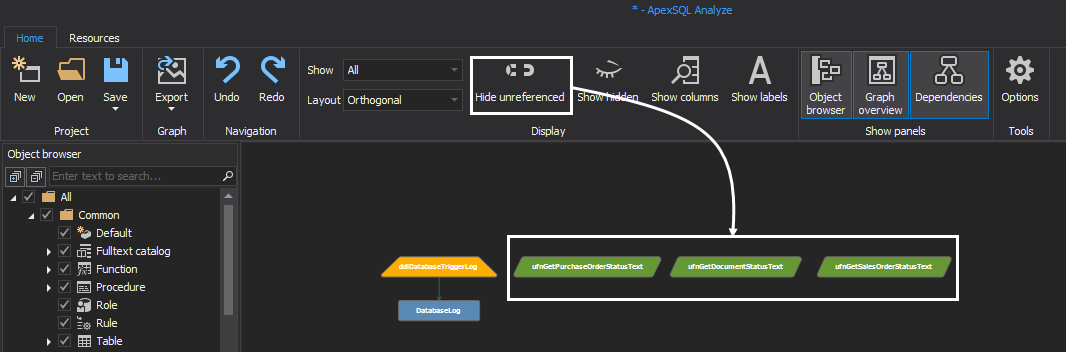
Additionally, when those objects are hidden, they and any other hidden objects can be shown by clicking the Show hidden button.
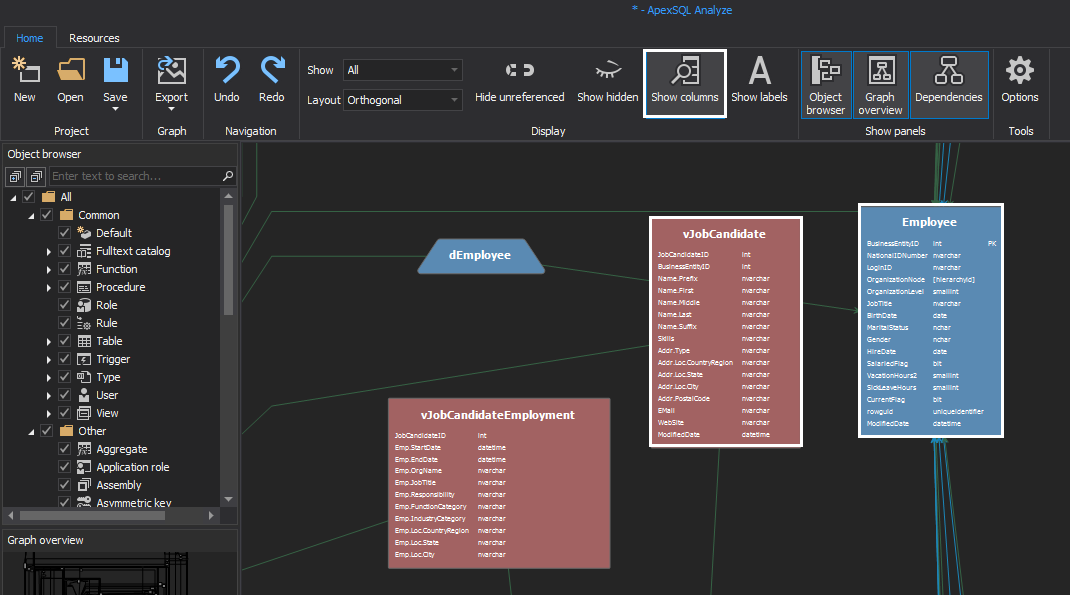
For a detailed column level view of each graphically represented object, select the Show columns option:
This option shows columns with datatypes of the tables and views
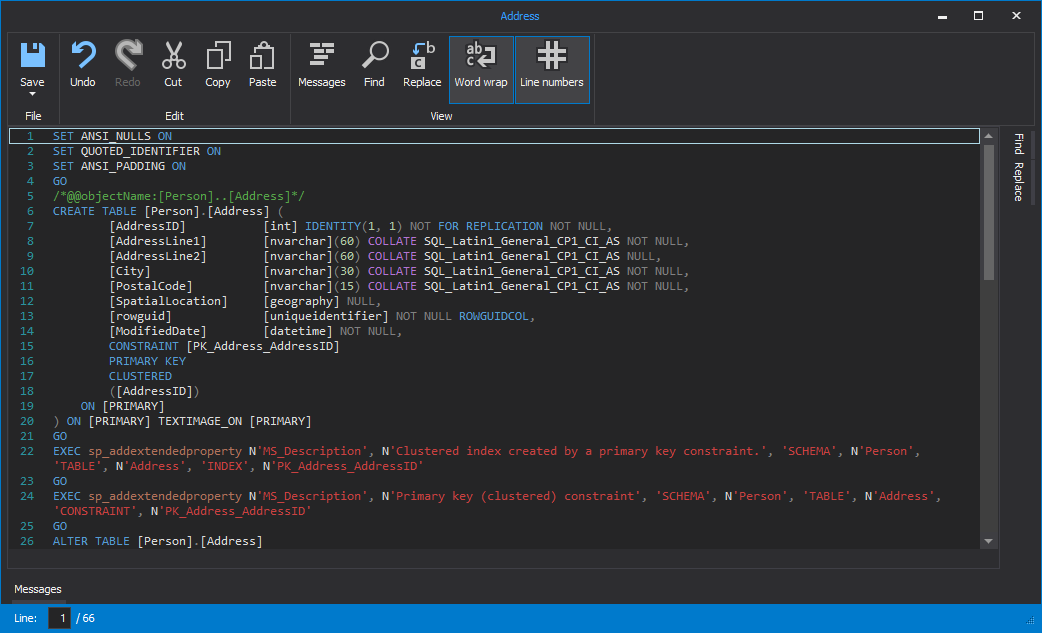
Additionally, the definition of an object can be easily reviewed by selecting the desired object, for example the Address table, right click and from the context menu and select the Show script command
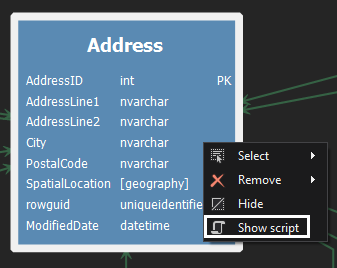
The script window will appear with definition of the selected object
Database dependency diagrams can be exported into high definition images that can be saved for later use, by clicking the Export button and saving the image in the desired output format including PNG, JPG and BMP.
Dependency diagram sections can be also exported by using the partial selection export feature. To export a part of the diagram, click the Export part option
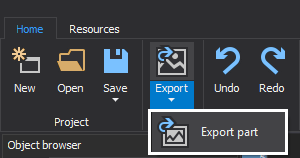
then press and hold the left mouse button and select the region which needs to be exported.
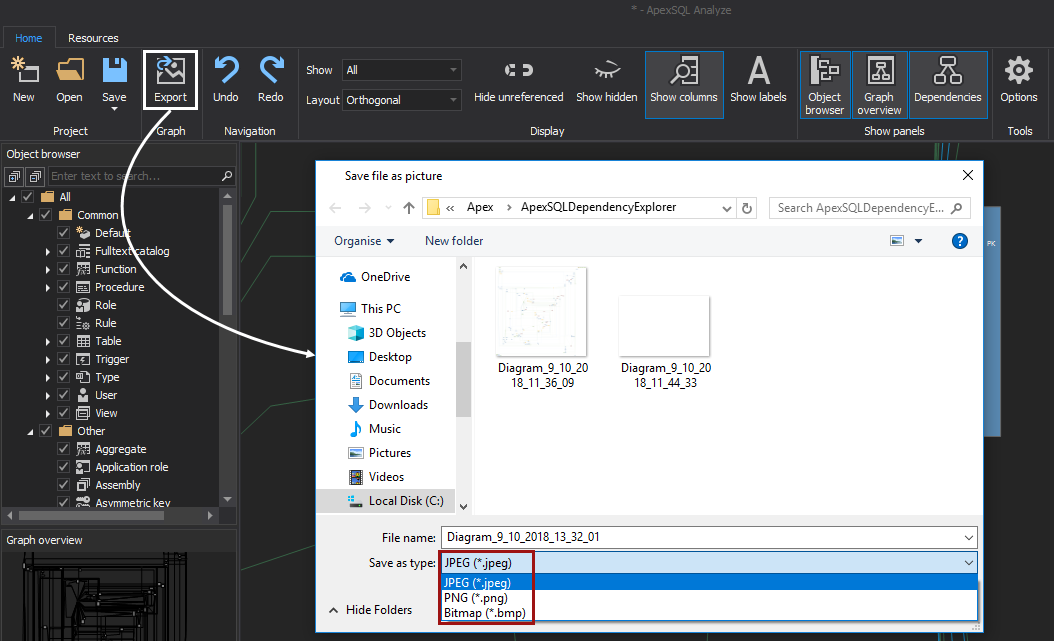
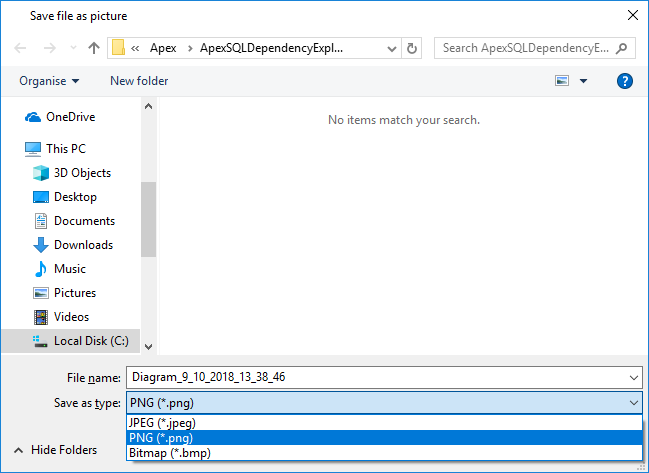
After releasing the left mouse button, the Save file as picture window will appear. In the File name box enter a name for the picture, under the Save as type drop down box choose one available type, for example PNG and press the Save button.
Now, go to the location where the picture is saved and open it

As you can see on the image only the selected area from the Dependency explorer is saved
Thanks for watching. For more information, please visit apexsql.com